
Burnham’s Blueprint | January 2026
Here is a pdf of our report below, along with an audio version.
Before we share our perspectives on the year ahead, we want to express our sincere gratitude for your continued trust. We are deeply grateful for the opportunity to guide you and your family, and we value the lasting relationship we have built together.
As we close out 2025, the economy remains remarkably resilient. Despite higher interest rates and geopolitical shifts, growth has persisted, inflation has moderated, and the widely feared recession never materialized.
Looking ahead to 2026, we anticipate a transition from broad market growth to a more selective environment. While global research firms expect continued expansion, the pace will likely be more moderate and uneven. As structural forces, such as artificial intelligence and global realignment, take center stage, we believe the “rising tide” of previous years will be replaced by a cycle that rewards discipline and thoughtful portfolio construction.
Our focus remains steadfast: aligning your capital with your long-term objectives and managing risk through these shifting market regimes. We look forward to navigating this next phase of the cycle with you.
Key Portfolio Adjustments in Q4
Trade Rationale
The government shutdown reduced the flow of updated economic data, but we still implemented a portfolio rebalance on 11/18/25 using broader market trends.
Equities
Increase our equity overweight to 3%, reflecting a more assertive risk-on stance supported by easing inflation pressures, resilient earnings growth, and an improving fiscal and trade policy backdrop.
U.S. Equity Factors
Rebalance U.S. factor exposures by leaning further into momentum, scaling back quality as relative signals soften, and introducing value as a deliberate diversifier to our existing growth-oriented positioning.
Non-U.S. Equities
Extend our underweight to developed ex-U.S. equities, reallocating toward the stronger earnings profile of U.S. markets and the increasingly technology-driven opportunity set within Emerging Markets, supported by stabilizing global trade conditions.
Fixed Income
Simplify fixed income allocations by introducing a new systematic bond strategy designed to adapt to evolving market regimes and opportunistically capture attractively valued credit, while maintaining an overall duration near neutral.
A strong earnings backdrop, a more accommodative Federal Reserve, and improved liquidity conditions support maintaining a constructive risk posture. With inflation’s more persistent components beginning to ease and forecasts calling for roughly 4% real GDP growth through Q4 and into early next year, we believe the macro environment justifies leaning further into risk.
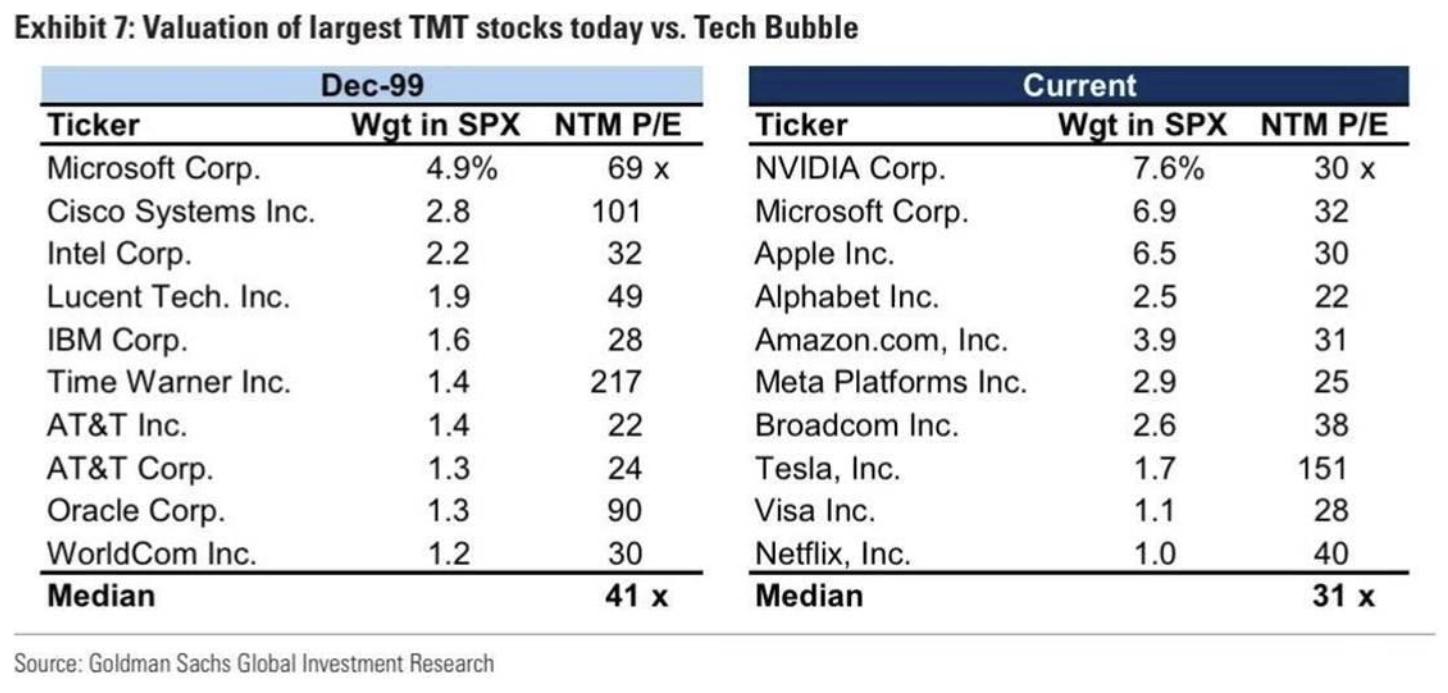
Is today’s euphoria similar to the TMT Bubble in the late 90s?
Concerns about speculative excess have grown louder, but we view much of the “bubble” narrative as overly simplistic. While valuations are elevated in parts of the market, today’s AI investment cycle looks far less like a speculative build-first-figure-it-out-later era we experienced in the late 90s. This one is far more like a capital-disciplined, cash-flow-funded productivity expansion.
Taken from Howard Mark’s latest memo ….. “is it a bubble”
As you view the table below, which comes from Goldman Sachs, you’ll notice that during the internet bubble of 1998-2000, the p/e ratios were much higher for Microsoft, Cisco, and Oracle than they are today for the biggest AI players – Nvidia, Microsoft, Alphabet, Amazon and Meta (Open AI doesn’t have earnings). As you can see, Microsoft’s on a half-off sale relative to its p/e 26 years ago.
The U.S. economy expanded at an annualized rate of 4.3% in the third quarter, according to the latest real GDP data its fastest pace in the past two years.
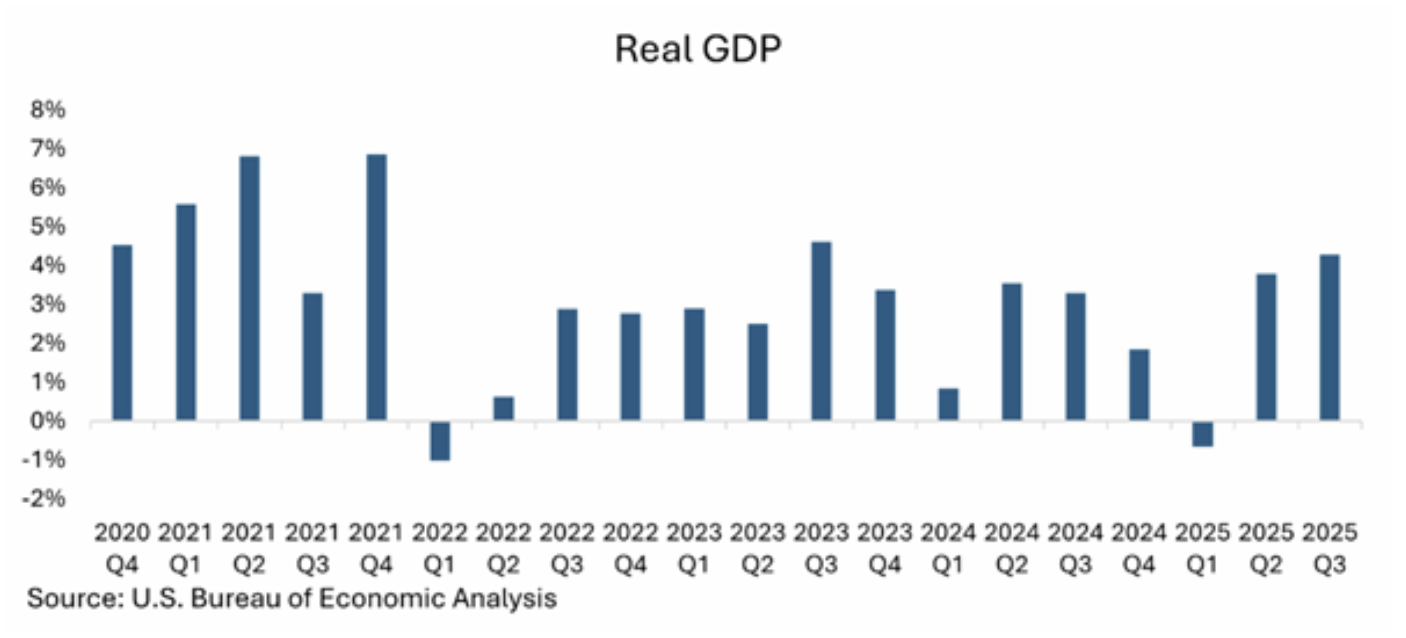
Despite ongoing concerns around the labor market, tariffs, and inflation, economic growth exceeded expectations, highlighting a resilient backdrop supported by strong consumer demand even as job growth shows signs of cooling. Consumer spending rose 3.5% for the quarter, accounting for more than half of total real GDP growth. Additional support came from net exports, as exports increased while imports declined 4.7%, likely reflecting the impact of tariffs.
Inflation pressures also intensified during the quarter. The Personal Consumption Expenditures (PCE) index increased 2.8%, up from 2.1% in the second quarter, underscoring continued pressure on prices. Core PCE, which excludes food and energy, rose 2.9%, broadly in line with the headline measure.
Looking ahead, fourth-quarter growth may soften due to the effects of the government shutdown, however, this is expected to be temporary, with economic activity likely rebounding in early 2026.
")
")
The leading economic index is typically our telltale signal of economic strength for the months and years ahead.
Bureau of Labor Statistics, Conference Board, J.P. Morgan
Q4 Recap
The markets saw steady returns:
- Gold was the best performing asset class in 2025 (+63.32% as of 12/12/2025).
- All S&P 500 sectors were positive.
- Emerging stocks outperformed large-cap.
We’ll see how employment and inflation are affected by recent policy moves and whether the markets will react in 2026.
The Current Landscape
")
Up to December 12, 2025
")
Recession Probabilities
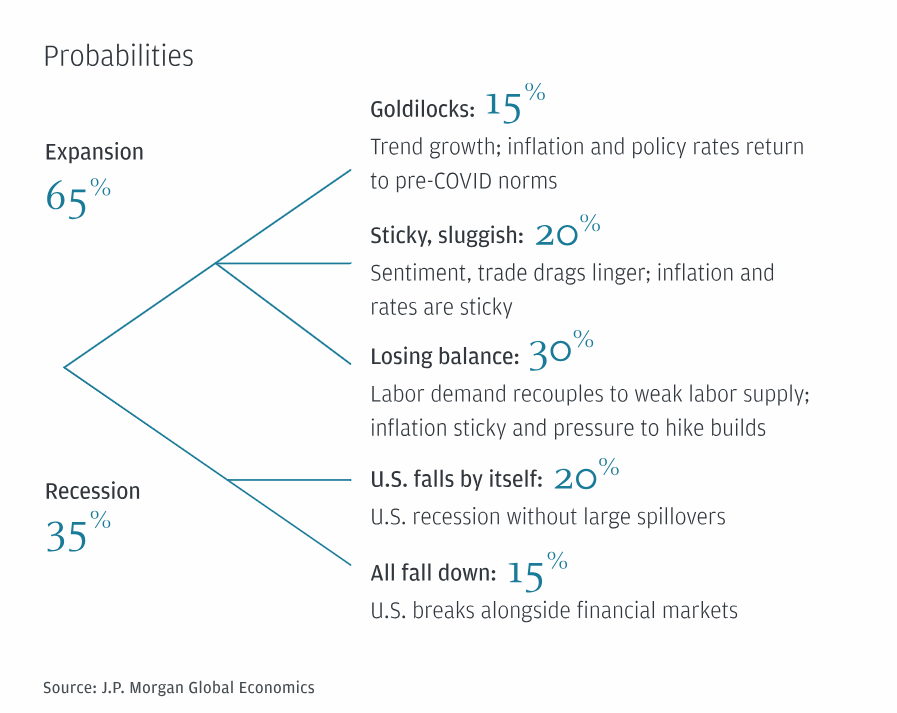
J.P. Morgan estimates that there is a 35% chance of a US and global recession in 2026. Global GDP growth is expected to receive a boost in the first half of the year thanks to front-loaded fiscal stimulus, promoting a rebound in sentiment. Nevertheless, business caution is the primary drag on hiring, reflecting trade war concerns and sluggish non-tech demand.
Moreover, weak labor demand is starting to erode purchasing power, particularly in the U.S., where softening private sector labor income growth is combining with firming inflation and a concentrated near-term public sector drag (J.P. Morgan Global Economics).
Earnings
Earnings expectations remain constructive heading into year-end. For the fourth quarter, the S&P 500 is projected to deliver 8.3% year-over-year earnings growth, up from 7.4% at the start of the quarter. Revenue growth is expected to remain healthy at roughly 5.9% year-over-year, supported by steady consumer demand and resilient corporate pricing power.
Earnings revisions have been notably positive. Since late September, analysts have revised Q4 estimates higher, bucking the typical seasonal pattern where estimates decline by roughly 3% during the quarter. The ratio of companies issuing positive guidance is running above historical averages, signaling confidence in demand conditions heading into 2026.
- Technology: Technology is expected to once again lead earnings growth, with profits projected to rise 18–20% year-over-year. Semiconductors remain the primary driver, supported by sustained AI infrastructure spending. The sector has also been one of the strongest performers in price terms during the quarter, reflecting investor willingness to pay a premium for growth visibility.
- Financials: Financials earnings are projected to grow approximately 9–10% year-over-year in Q4, a modest improvement from earlier estimates. Banks benefit from stable net interest income and resilient credit conditions, while capital markets activity improves modestly from earlier in the year. Consumer finance and asset managers drive much of the upside, while insurers see more mixed results due to claims normalization.
- Communication Services: Communication services earnings are expected to rise roughly 4–5% year-over-year, continuing the recovery seen earlier in 2025. Interactive media and wireless services drive revenue growth, helping offset continued pressure in legacy media segments.
-
Utilities and Materials: Utilities earnings are projected to grow in the mid-teens, supported by rate base expansion and improving power demand. Materials earnings are expected to grow at a high-single-digit rate with earnings above prior year levels, with strength in metals & mining and construction materials offset by continued weakness in chemicals.
-
Healthcare: Health care earnings growth is expected to remain subdued at approximately 2–3% year-over-year. Managed care remains under pressure from higher utilization and margin compression, while pharmaceuticals and medical devices provide modest offsets.
-
Energy & Consumer Staples: Energy earnings are expected to decline roughly 4–5% year-over-year, reflecting lower average oil prices compared to last year. Refiners and midstream companies provide relative stability. Consumer staples earnings are also projected to decline modestly, pressured by margin constraints and slowing volume growth.
- Looking Ahead: Earnings momentum is expected to accelerate into 2026. Current forecasts call for 11.7% earnings growth in Q1 2026 and 12.7% in Q2 2026, following Q4’s 8.3% gain. For full-year 2025, S&P 500 earnings are expected to rise approximately 10–11%. Valuations remain elevated, with the forward 12-month P/E near 22.5, above long-term averages, leaving markets increasingly dependent on sustained earnings growth to justify current price levels.
")
FactSet, 11/7/2025, 12/15/2025, 12/19/2025
The Consumer
Consumer spending cyclically goes up during the holiday months of November and December, and we saw a similar trend in 2025 with an increase of 3.9% in December from last year (The New York Times, 12/23/2025). Consumer sentiment increased slightly from November to just over 52% in the final month of the year, but it fell by 28.5% from a year earlier (The University of Michigan, 12/5/2025). One statistic we’ll continue to keep an eye on in 2026 is the rise of Buy Now, Pay Later spending, with a 2025 Experian survey predicting that almost 43% of consumers used financing for their holiday shopping, up from 20% in a similar survey taken in 2023 (Experian, 12/16/2025). While the top 10% of earners in the US make up over 50% of spending, the consequences of delinquent loans, delayed payments and interest accumulation is yet to be determined in measuring the true strength of the American consumer – and the overall economy (Marketplace, 9/17/2025).
Labor Markets
The December 2025 unemployment rate changed little to 4.4% from November’s 4.5% (revised). Total nonfarm payroll employment increased by 50,000, with jobs in food services and drinking, health care, and social assistance trending up. Retail trade lost 25,000 jobs in December. Average hourly earnings for all employees rose by 0.3% and increased by 3.8% year over year, outperforming inflation to November of this year (Bureau of Labor Statistics).


Bureau of Labor Statistics, 12/16/2025
One new piece of data we’ve looked at over the past year is CEO outlook’s correlation with employment. The graph below is pulled from CEOs participating in the Business Roundtable and showcases how little changes in hiring affect the broader labor market. While the employment sub-index is slightly lower than Q3 of 2024, other leading indicators may be more reliable in evaluating the forward momentum of the economy. Similarly, we see exaggerated CEO outlook compared to GDP growth in the second graph.
")
Business Roundtable
Corporations
")
Business Roundtable
Compared to large public company indices, the small business index is less volatile and more closely reflects regional labor market and GDP conditions. Over the past three years, sentiment has typically been strongest in Q2 and Q3, as shown below.
")
U.S. Chamber of Commerce
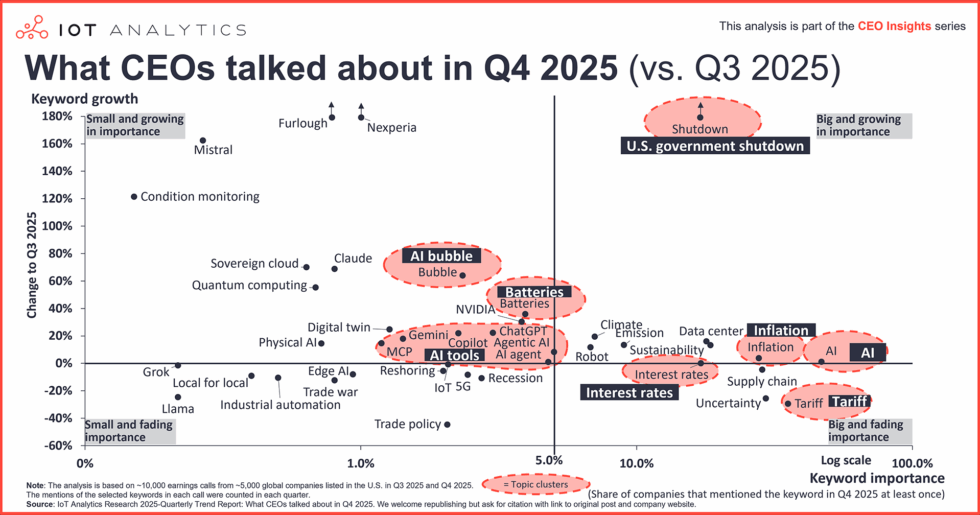
On October 1, 2025, the U.S. government entered the longest shutdown in its history, lasting 43 days, driven by disagreements over extending healthcare subsidies. The resulting pause in data collection and furloughing of federal workers influenced CEO commentary on earnings calls this quarter. References to tariffs declined sharply from earlier in the year, while mentions of inflation and AI continued to increase (PBS, 11/13/2025).
Policies
Some Highlights from The One Big Beautiful Bill Act
(OBBBA) Permanent Extension of Individual Tax Rates and Standard Deduction: The current individual tax brackets and the increased standard deduction are made permanent
Restoration of 100% Bonus Depreciation and R&D Expensing: The Act permanently restores 100% bonus depreciation for qualified property acquired after January 19, 2025, and allows for the immediate expensing of domestic R&D costs.
Permanent Qualified Business Income (QBI) Deduction: The 20% deduction for qualified business income for owners of pass-through entities (e.g., S corps, partnerships, and LLCs) is made permanent.
Increased Estate and Gift Tax Exemption: Effective January 1, 2026, the exclusion amount increases to 15 million dollars (30 million dollars for married couples), adjusted annually for inflation beginning in 2027.
Trump Accounts Creation: The Trump Account was established as a tax-advantaged investment account for children who are US citizens and born Jan 1, 2025-Dec 31, 2028. These accounts will include a 1000 dollar seed provided by the government to kick-start the investing journey (White House).
While these changes offer significant tax benefits and potential investment opportunities, the OBBBA is projected to add trillions to the national debt, which could put upward pressure on bond yields and interest rates over the long term. Investors should consider these macroeconomic impacts, remain diversified, and consult with their financial advisor (IRS).
I’ve heard about circular deal making in AI. What does that mean?
The tech bubble economists, news outlets and analysts have been describing is elevated, in part, by the circular deal making we’ve seen among the largest AI infrastructure, computing and product companies (PBS, 12/29/2025). Increased valuations based on borrowed money from players on the same team have stoked fear that one of the highest performing sectors of the last few years is overvalued and that its expected revenue won’t measure up to expectations. Further, we see heightened consolidation in the S&P 500, with the Mag-7 consisting of tech giants controlling over a third of the index’s market cap. This could increase the chances of any meaningful dip in the market for tech affecting the index more broadly. Other sectors, like utilities and consumer services, can be entangled with AI by the nature of their business and the far-reaching capabilities of this technology. We believe the long-term growth potential and transformative properties of AI will outperform market volatility and corrections we may see in the future. Staying invested and diversifying geographically, sector-based, and asset-based are our solutions to tech developments from the TMT bubble to social media to AI.
What’s going on with tariffs today?
Following the fourth-largest US-market correction in the 21st century, consumer confidence rebounded into Q3 and the remainder of the year.
Labor market uncertainty has remained elevated throughout the year, with recent numbers revealing a drop in hiring into the end of 2025. Part of this uncertainty has surrounded price increase concerns, with companies potentially having to pass higher-priced items onto consumers in exchange for employee retention, or absorb and maintain profit margins with layoffs. November 2025 inflation cooled, with the trade deficit declining from the start of the year. As the deficit returns to earlier levels, we’ll be able to better parse whether the dual mandate is being directly affected by tariffs.
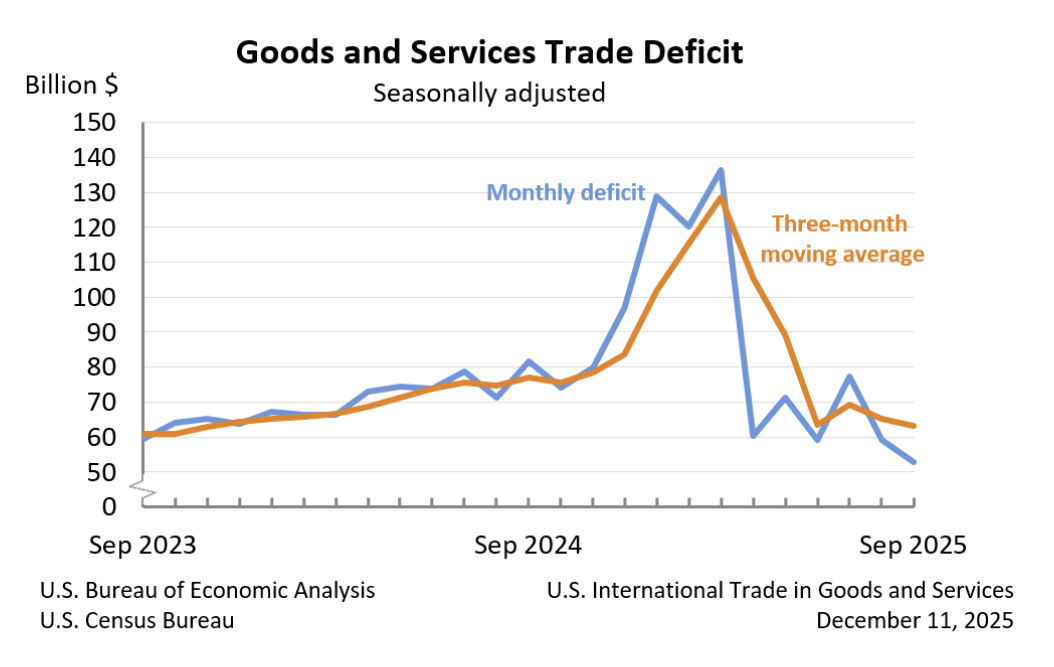
In the meantime, trade concessions have been established throughout the year. In Q4 alone, the US White House released 18 briefings on trade concessions with countries including Cambodia, Vietnam, and other nations hit with the highest tariff rates in April (The White House).
Chinese tariffs have fallen to 34%, to be implemented in November 2026, from the aforementioned 100-200% tariffs.
Interest Rates
Expert consensus and market pricing overall anticipate two Federal Reserve rate cuts in 2026. However, some Fed officials project a more cautious path with only one cut, while a minority of economists anticipate three cuts. Expected timing is commonly centered around April and September, depending on incoming economic data.
- January: Maintained
- March: Maintained
- May: Maintained
- June: Maintained
- July: Maintained
- September: ¼-point rate cut between 4 and 4.25
- October: ¼-point rate cut between 3.75 and 4
- December: ¼-point rate cut between 3.5 and 3.75. Unemployment rate has edged up since September, and job gains have slowed. Inflation has moved up since earlier in the year and remains elevated (Federal Reserve, 12/10/2025).
Inflation
CPI increased 0.2% from September to November. Over the last 12 months, it increased 2.7%.
Energy rose 1.1%, the highest, and food increased 0.1%. Home, recreation and apparel prices decreased over the 2-month period (Bureau of Labor Statistics, 12/18/2025).
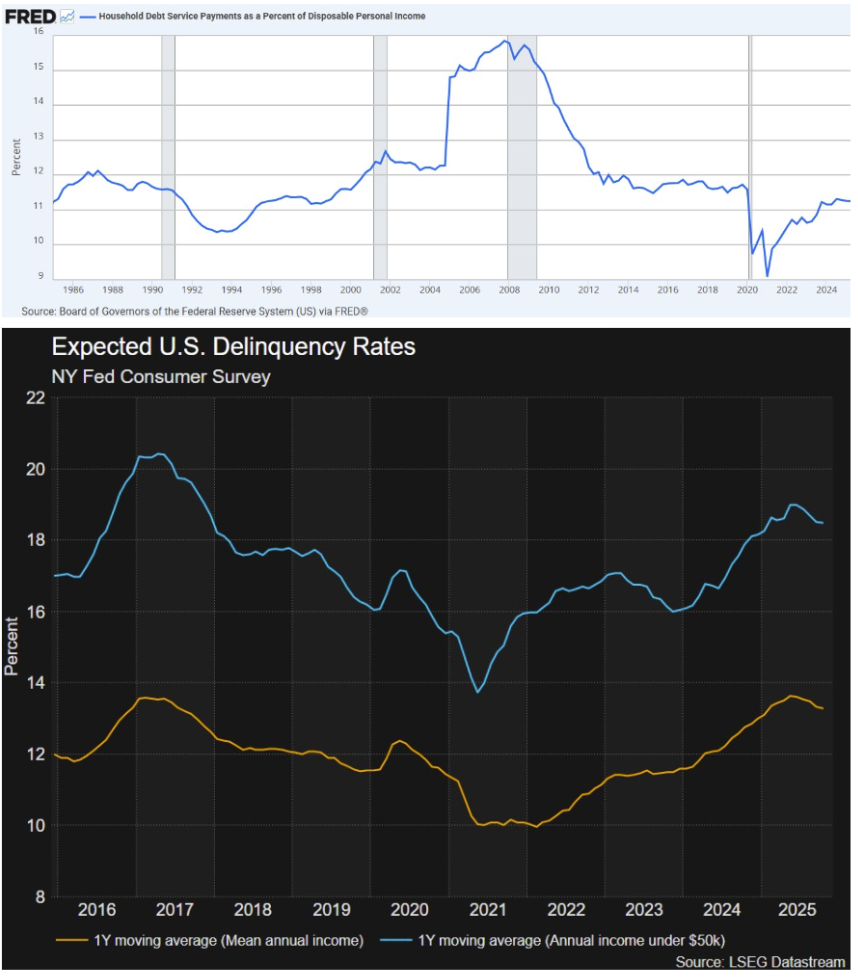
Consumer Balance Sheet
In Q4 2025, financial strain on U.S. households remained elevated as credit card balances stayed near record highs around 1.2 trillion dollars, with delinquency rates continuing to rise. What initially affected lower-income borrowers had become more widespread, as middle- and higher-income households increasingly struggled with monthly payments amid persistent high interest rates. By late 2025, about 12.5% of credit card accounts were 90+ days past due, up from mid-year and well above year-ago levels (10.93%), indicating stress across most age and income groups. Surveys reinforced the trend, showing elevated reports of paying less than the minimum balance and continued reliance on balance transfers and debt consolidation to manage cash flow. The exact year-end Q4 numbers may differ due to seasonal spending (i.e., holiday charges/payments). We will know more when the Quarterly Report on Household Debt and Credit is revealed on February 10, 2026. Meanwhile, the Federal Reserve’s Senior Loan Officer Opinion Survey showed further tightening in credit standards for credit cards and unsecured loans, driven by rising delinquencies and weaker borrower profiles. While consumer spending held up, underlying financial strain suggests households are increasingly vulnerable heading into 2026 (New York, KPMG, Reuters, Federal Reserve).
Geopolitical Risks & Opportunities
The US’ increased reliance on services for GDP was challenged this year with tariff negotiations and the drive to bring American manufacturers within our borders.
North America
Mexico, Canada, and China are the US’ largest trading partners, making this year’s tariff implementations threatening to domestic and foreign business owners with factories outside our borders (Trade Compliance Resource Hub). Mexico saw growth in their services sectors and contraction in their automotive goods sector (BBVA Research, 10/25/2025). Meanwhile, Canada eclipsed the US in market returns in 2025, with materials and financial services leading the way. Canada’s tech sector is far behind the US’.
South America
In an effort to regain oil access previously lost to Venezuelan nationalism, the US government bombed Caracas, Venezuela on January 3, 2026 and captured President Maduro. We will keep you updated throughout the year on how the price of oil is affected by this latest development (Al Jazeera, 1/3/2026). As of January 5, 2026, the price of crude oil sits at .32 (Trading Economics).
The US invested 20 billion dollars in the Argentinian treasury fund to help stabilize their economy in the midst of a falling peso (Reuters, 11/11/2025). Brazil’s economy contracted slightly in 2025 following agriculture declines based on environmental factors (Deloitte, 11/20/2025).
Asia
South Korea and Taiwan’s economies outperformed, with the former seeing the fastest economic growth in four years and the latter – in 15, following increased construction and semiconductor facility output. Top industries include automotive manufacturing, IT and AI infrastructure (The Korean Economic Daily, 12/3/2025). China’s trade surplus continued to increase in 2025 despite the US tariff shakeup at the start of the year. The Chinese government has cracked down on regulating tech, real estate and tutoring companies, namely in the Beijing area, leading to increased movement of new grads to the public sector for employment (China Briefing, 12/22/2025).
Europe
The EU saw a stark realignment from investments in the US, marked by tariffs at the start of the year, with a 15% max duty rate (IEA). Recent trade negotiations have lessened the pressure on European countries like Switzerland, whose Central Bank’s recent decrease in foreign currency investment in Q3 of 2025 signals a lesser need to strengthen the franc (Reuters, 12/31/2025).
Africa
South Africa, accounting for the highest GDP in the continent, was hit with 30% tariffs by the US in 2025 yet saw economic growth following a recovery from their energy crisis peaking in 2023. Yet, systemic inequality is not reflected in the country’s GDP as unemployment reached 31.9% in Q3 of 2025 (Daily Maverick, 12/31/2025). South Sudan’s economy has been in freefall, exacerbated by 2024 flooding in oil rich regions and other climate catastrophes that have affected the country’s primary export, hurting jobs and deflating their currency (New Security Beat, 9/3/2025).
Australia
Australian GDP rose by 0.4% in Q4 of 2025, with household saving to income ratio rising to 6.4% from 6.0% (Australian Bureau of Labor Statistics, 12/3/2025).
Commodities
As Q4 2025 came to a close, commodity markets are navigating persistent inflation, slowing global growth, ongoing energy transition, and geopolitical tensions. Precious metals continued to attract safe-haven demand, while energy and industrial metals faced pressure from supply growth and softer demand.
Energy and Oil
Oil prices were under pressure in Q4, with Brent crude averaging ~62 dollars and West Texas Intermediate around 58–59 dollars per barrel. Demand growth slowed, particularly in Europe and Asia. The World Bank energy price index shows a modest decline of roughly 4% year-over-year, reflecting resilient supply and subdued consumption.
Precious Metals
Gold and silver retained strong support from inflation concerns. Gold closed the year near ~4,400 dollars per ounce, while silver hovered around ~76 dollars per ounce.
Base and Industrial Metals
Base metals experienced ongoing weakness due to slowing industrial activity in major economies like China. Copper traded above 12,000 dollars per metric ton.
Battery metals, including lithium and cobalt, were supported by tight supply and growing demand from electric vehicle and renewable energy sectors.
Agriculture and Soft Commodities
Weather-driven risks continued to shape agricultural markets. U.S. and Brazilian crop conditions improved in some regions. Cocoa prices stayed elevated due to West African supply issues.
The World Bank projects overall global commodity prices to decline roughly 4–5% in 2025, with energy leading the drop and agriculture easing slightly. Key Q4 themes include sector divergence, volatility, and macroeconomic feedback into inflation and policy (Trading Economics, World Bank, Business Insider).
Government Spending and Deficits
Fiscal Snapshot – Q4 2025
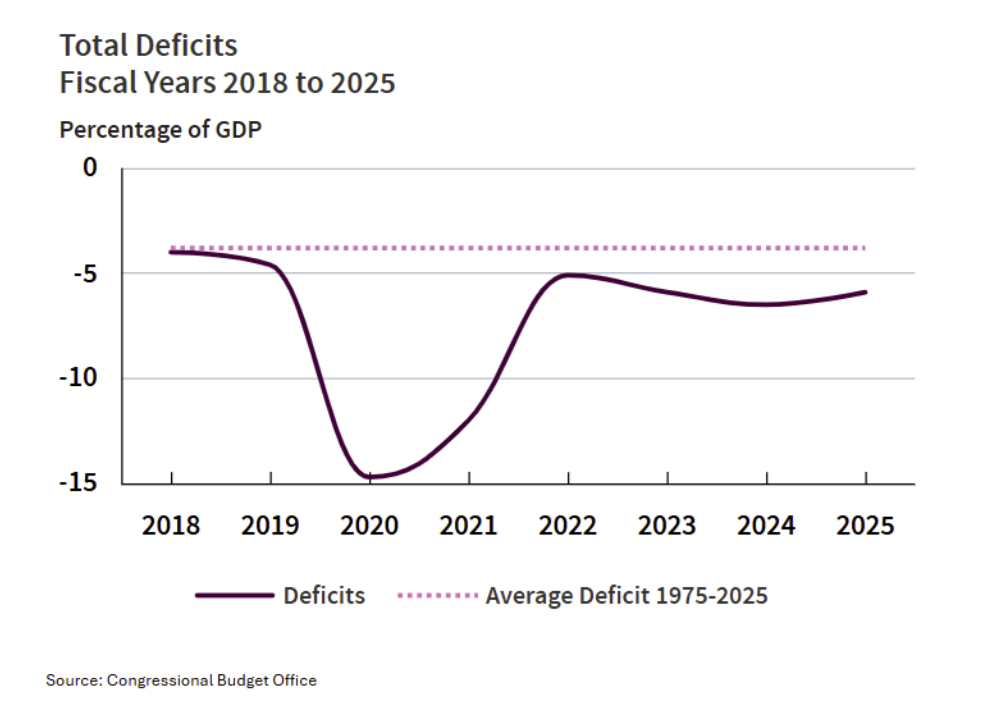
The U.S. federal deficit for fiscal year 2025 is now estimated at about 1.8 trillion dollars, or roughly 5.8–6.0% of GDP, marking one of the largest deficits outside times of war or recession. Total federal spending is estimated around 7 trillion dollars, while revenues are near 5.2–5.23 trillion dollars, leaving a substantial gap between outlays and receipts.
Trends & Drivers
Mandatory outlays — including Social Security, Medicare, and Medicaid — continue to grow with demographic shifts and rising healthcare costs, consuming an increasing share of the budget. Interest costs on the national debt are also climbing, with net interest expenditures nearly 1 trillion dollars in 2025, making debt service one of the fastest‑growing components of federal outlays and rivaling defense spending. Discretionary spending remains elevated, while tariff revenues and certain policy changes modestly cushion the deficit but are not large enough to materially reduce long‑term imbalances.
Outlook & Risks
Federal debt held by the public is approaching around 98–100% of GDP as of the end of FY2025, with total public debt exceeding 38 trillion dollars. Current projections suggest that without policy changes, debt will continue rising relative to GDP in the decade ahead.
Persistent high deficits leave the fiscal position vulnerable. if economic growth slows further, interest rates remain elevated, or new spending pressures emerge, debt dynamics could deteriorate sharply. Policymakers and investors alike are watching fiscal sustainability risks as they re‑enter the spotlight (Bipartisan Policy, U.S. Government Accountability Office, Congressional Budget Office).
The Long-Term Investing Playbook
As a reminder, most times it is best to ride out the ebbs and flows that the market experiences. Investors who bought on Jan. 1, 2025 and sold during the Liberation day volatility would’ve experienced a realized loss of <15.09%> versus staying the course and being up 17.88%, a 32.97% swing.

What we read/watched/listened to this quarter


“As both an Entourage die-hard fan from the mid-2000s and the father of a dyslexic child, I’ve long admired Ari Emanuel’s career and perspective. This interview did not disappoint. The title alone caught my attention, especially in a world where conversations have been relentlessly pro-AI. Ari’s core thesis is compelling: as AI floods the market with cheap, digital content will shift toward live, physical, and experiential assets that technology can’t replicate. He shared insights on leveraging technology, relentless follow-up, and building integrated companies like Endeavor/TKO to capitalize on these trends.” – James M. Corrigan, CFP, CPWA


“A gripping, fast-paced account of a young couple’s audacious art crime spree across Europe from 1995 to 2001. The sheer scale and estimated value of the stolen works are staggering, but even more striking is the mastermind’s rationalization for the thefts, which left me both fascinated and incredulous. A reminder of how easily conviction can blur into delusion when unchecked by reality.” – Sean M. Jucas, CFP, CPWA, SE-AWMA
")
")
“The premise of the book is avoiding unforced errors. Ritholtz argues that investment success is more about behavior than brilliance. The book touches on the behavioral biases many investors exhibit. Further, Ritholtz explains why risk is not volatility and instead permanent loss. The author touches on some of his core principals of investing: avoiding macro forecasts, staying diversified, keeping costs low, and focusing on long-term compounding.” – David Holtkamp, CFA, CFP, CPFA

")
“An honest look at how real people actually invest, rather than a rigid rulebook, highlighting the importance of behavior over brilliance, showing that discipline, diversification, and consistency matter more than trying to beat the market. It also pulls back the curtain on mistakes, trade-offs, and emotional decisions that investors face but rarely talk about. The book encourages investors to build strategies they can stick with through both calm and chaotic markets while emphasizing there is no single ‘right’ way.” – Basel Alwawi
")

“This book constructed the narrative around the biggest players on wall street nearly 100 years ago in an unregulated and unprecedented landscape. The 1929 stock market crashes and subsequent depression started a wave of reformation in the securities industry, including the establishment of the FDIC, SIPC, and SEC. Finishing it just after getting my registration helped me understand our industry as one that is ever-evolving toward client centricity.” – Iris Swarthout
Registered Representatives of Sanctuary Securities Inc. and Investment Advisor Representatives of Sanctuary Advisors, LLC. Securities offered through Sanctuary Securities, Inc., Member FINRA, SIPC. Advisory services offered through Sanctuary Advisors, LLC, an SEC Registered Investment Advisor. Burnham Harbor Private Wealth is a DBA of Sanctuary Securities, Inc. and Sanctuary Advisors, LLC.
No representation is made as to the accuracy or completeness of information contained herein. The information is based upon data available to the public and is not an offer to sell or solicitation of offers to buy any securities mentioned herein. Any forward-looking statements are based on assumptions, may not materialize, and are subject to change without notice. Any investment discussed may not be suitable for all investors. Investors must make their own decisions based on their specific investment objectives and financial circumstances. Investments are subject to risk, including but not limited to market and interest rate fluctuations. Any performance data represents past performance which is no guarantee of future results.