Burnham’s Blueprint | October 2025
Click Here for an Audio Version
Market activity and headlines in Q3 were calmer than Q2, when daily tariff developments dominated the news cycle. In Q3, the S&P500 recorded 24 new all-time highs (FRED, S&P 500). In mid-September, markets pushed to new highs after the Federal Reserve cut its benchmark interest rate and signaled the start of a broader easing cycle, rather than a single, one-off move. All three major indices set new records, with the Nasdaq leading on strong momentum from technology, including Nvidia’s announced investment in Intel. Importantly, the small-cap Russell 2000 also reached a record high for the first time since 2021, signaling broader market participation beyond the large-cap leaders.
Historically, rate-cutting cycles have been supportive for equities, particularly when markets enter them at or near record highs. While periods of volatility are common, history shows the S&P 500 has typically generated positive returns over longer time frames following similar rate-cutting environments.
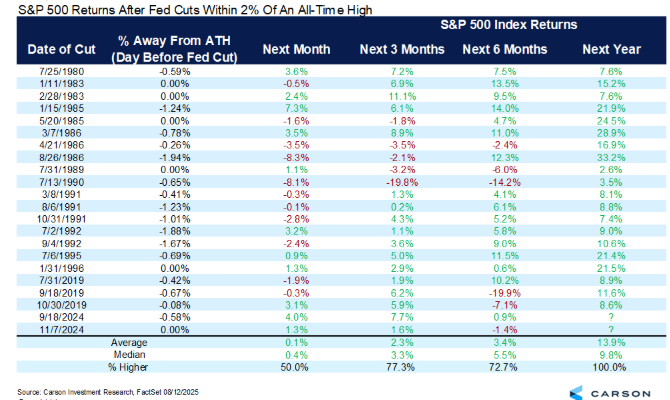
How markets have historically performed when the index is within 2% of an all-time high and The Fed starts to cut rates:
Carson Research, 8/12/2025
Success Rate Highlights (from Carson Research graph above):
- Long-term reliability: Markets are positive 80% of the time in the year following Fed rate cuts
- Short-term variability: Only 55% positive return in the next month, but this improves to 75% over 3 months
- Patient investors win: The longer the time horizon, the higher the success rate
On Oct 1st, the US government entered a shutdown over a government funding bill. While typically government shutdowns result in the furloughing of federal employees, the current administration has pointed to permanent layoffs within the federal workforce if the two parties cannot come to an agreement.
Historically, government shutdowns have had little effect on the S&P 500 and the broader economy.
Looking Ahead
As we enter the final quarter of the year, investors will be focused on three key questions: the pace of Fed rate cuts, how corporate earnings adjust to lower borrowing costs, and whether market leadership broadens beyond large-cap technology. Inflation, consumer spending, and profit margins will remain central drivers of sentiment and portfolio outcomes. While some volatility is likely as markets recalibrate to a new policy environment, we believe the backdrop supports continued opportunities across both equities and fixed income as the cycle unfolds.
Key Portfolio Adjustments in Q3
- Increased Equity Allocation: Added 1% to equities, moving to a 2% overweight. This modest tilt raises market exposure in light of a friendlier policy backdrop while retaining portfolio shock absorbers.
- U.S. vs. International Tilt: Leaned further into the relative earnings strength of U.S. companies versus developed markets abroad. Domestically, we continue to favor growth over value; internationally, we emphasize value over growth.
- AI Infrastructure & Enablers: Increased exposure to the “picks and shovels” of artificial intelligence—compute, cloud, and software providers—positioning for what we view as the next industrial revolution.
- New Aerospace & Defense Theme: Initiated a global aerospace and defense position, targeting companies expected to benefit from a multi-year modernization cycle and rising government investment.
- Bond Positioning: Maintained near-neutral duration overall, while adding convertible bonds to bond-heavy portfolios for more equity-like upside with a bond floor.
Trade Rationale
We’ve cautiously pressed the accelerator. Growth signals remain mixed and the labor market has softened, but this slowdown has opened the door for more accommodative monetary policy. Inflation is still sticky near 3%, yet history reminds us: “don’t fight the Fed.” We’re leaning into that tailwind—selectively and with safeguards.
- Equities & AI: We view AI not just as a growth driver but also as a defensive hedge. The scale of capital flowing into AI infrastructure—potentially half a trillion dollars annually—makes it, in our view, a durable, multi-decade trend comparable to the rise of the internet. We seek to capture this through active strategies that can pivot as leadership shifts.
- Global Equities: Fed easing often weakens the U.S. dollar, which supports Emerging Markets. This led us to move modestly overweight EM and to neutralize our China underweight. At the same time, we deepened our underweight in developed markets outside the U.S., focusing instead on targeted value opportunities such as European financials.
- Defensive Offsets: We continue to pair offense with ballast. Precious metals serve as a hedge against policy and geopolitical risks. Convertible bonds provide “upside with airbags.” And thematic allocations to defense, cybersecurity, and infrastructure align portfolios with structural fiscal priorities governments are unlikely to reverse.
The bottom line: The Fed’s green light allows us to be selectively bold. We’re leaning in where probabilities favor us, but maintaining discipline where the outlook remains uncertain.
Table of Contents
- Q3 Recap …………………………………………………………………..1
- The Current Landscape……………………………………………2
- Recession Probabilities……………………………………..3
- Earnings…………………………………………………………….3
- The Consumer……………………………………………………4
- Employment……………………………………………….5
- Corporations …………………………………………………….6
- Policies ………………………………………………………………7
- Interest Rates……………………………………………..7
- Inflation………………………………………………………7
- On Burnham’s Radar…………………………………………………8
- Consumer’s Balance Sheet……………………………….8
- Debt……………………………………………………………9
- Consumer’s Balance Sheet……………………………….8
- Geopolitical Risks & Opportunities…………………………..11
-
- International Developed Markets……………….11
-
- Commodities……………………………………………………………12
- Government Spending and Deficits………………………..12
- AI……………………………………………………………………………..13
- Private Markets……………………………………………………….14
- In the Numbers………………………………………………………..15
- What We Read, Watched, and Listened to………………16
Q3 Recap
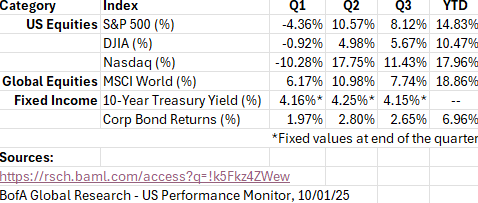
The markets saw steady returns after a tumultuous 2nd quarter.
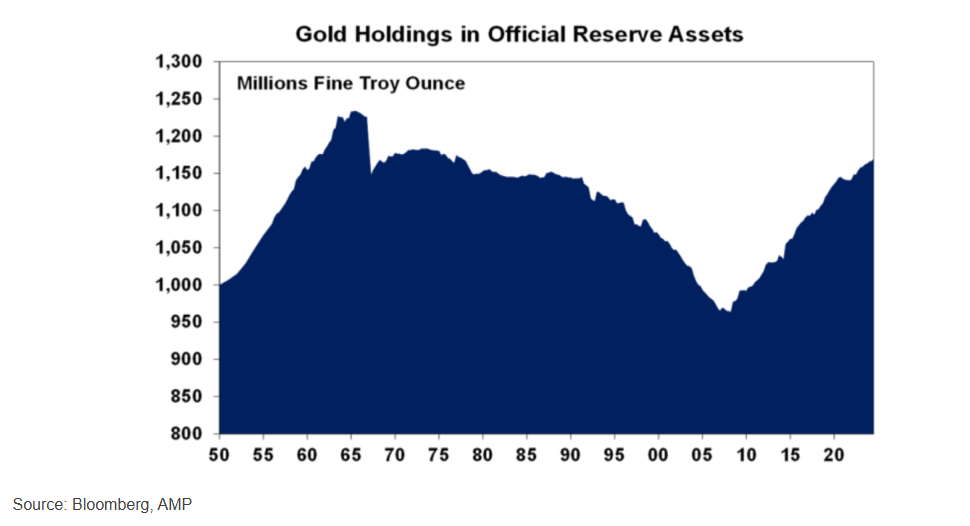
- Gold was the best performing asset class in Q3 (+16.4%)
- All S&P 500 sectors were positive, except Consumer Staples
- Small caps had their best quarter relative to large caps since 1Q21.
We’ll see how employment and inflation are affected by recent policy moves and whether the markets will react in Q4.
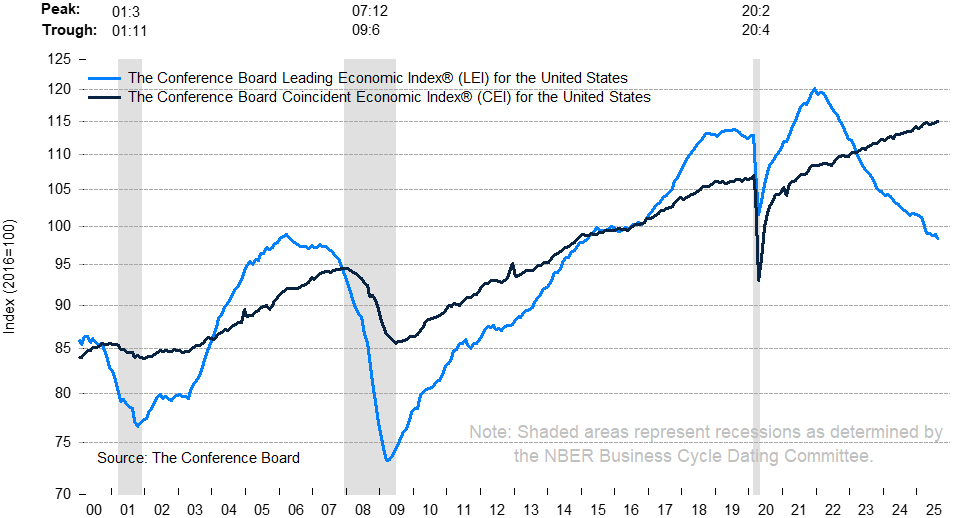
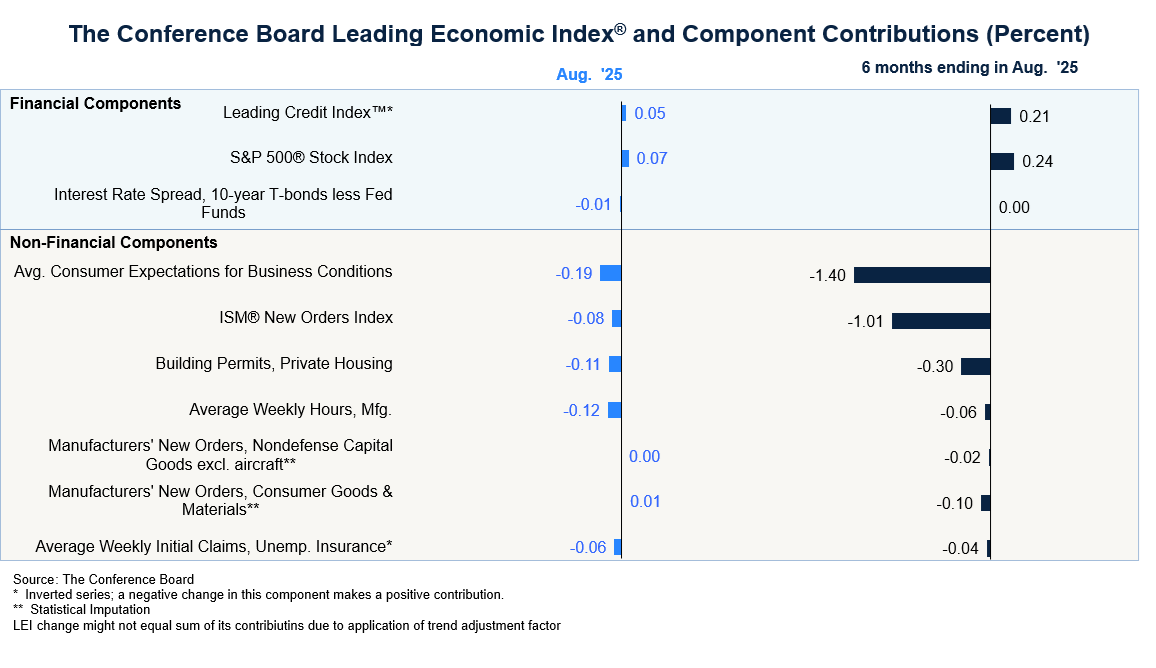
The leading economic index is typically our telltale signal of economic strength for the months and years ahead. As seen below, our leading indicators are mostly positive, with consumer sentiment and building permits falling at the end of summer.
Bureau of Labor Statistics, Confidence Board, Fed Reserve Board of St Louis, Bureau of Economic Analysis
The Current Landscape
Recession Probabilities
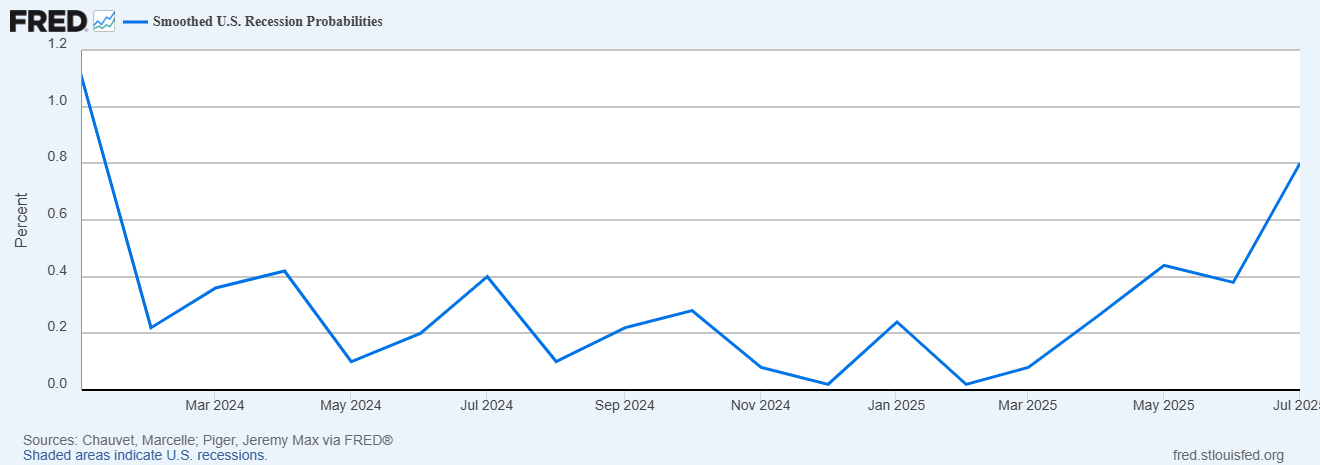
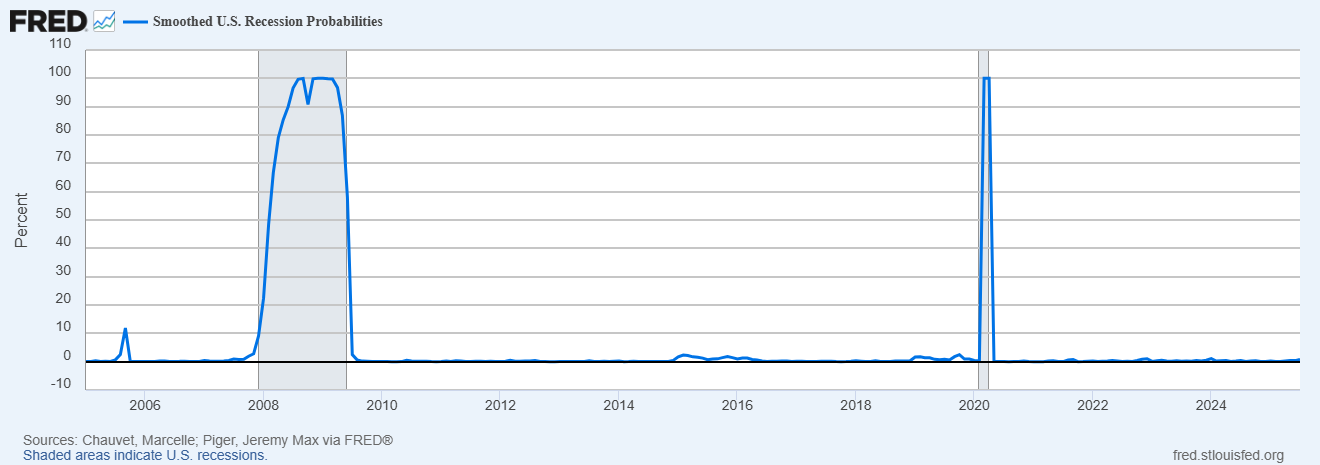
Recession probabilities have picked up since May of this year due to inflation and economic slowdown pressures, with September’s rate cut yet to be factored into the equation. Over the course of 20 years, we’ve seen recession probabilities spike to 5-10% every 2-5 years, indicating a normal pattern of market fear for a major drawdown.
The Federal Reserve Bank of St. Louis, 9/25/2025
Earnings season beat expectations, with the S&P 500 posting 7.9% year-over-year earnings growth and revenues up 6.3%, the second-fastest pace since 2022. It marks the index’s ninth straight quarter of earnings gains, driven by strong demand.
Notably, corporate guidance is more optimistic than usual, with half of the 112 companies issuing positive EPS outlooks—well above the historical average.
- Technology: Technology stands out, with 20.9% earnings growth in the quarter. Every sub-industry in the sector grew, with semiconductors leading the way at +45% year-over-year.
- Financials: Financials posted 11% earnings growth, a significant improvement from the 7.6% estimate in June. All industries in the sector posted gains, led by consumer finance and capital markets.
- Communication Services: Communication services earnings rose 3.6% year-over-year, up from less than 1% at the start of the quarter. The sector enjoys the largest stock price increase of any group since June. Interactive media and wireless services lead revenue growth.
- Utilities and Materials: Utilities delivered 17.5% earnings growth, the index’s second-highest. Independent power producers and electric utilities lead the way.
- Healthcare: Healthcare experienced the steepest downward revisions this quarter. Earnings grew just 0.3%, compared with more than 7% projected in June.
- Energy & Consumer Staples: Energy earnings fall 3.4%, the largest decline among sectors, as oil prices averaged 15% lower than last year. Consumer staples also declined 3.2%, dragged down by food and household goods.
Factset, 9/26/2025
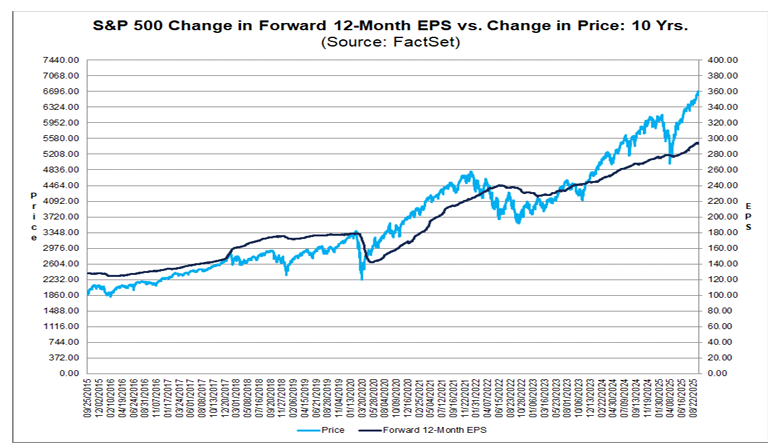
Looking Ahead: Analysts expect earnings momentum to continue into next year. Forecasts call for 7.3% growth in Q4 2025, followed by 11.7% in Q1 2026 and 12.7% in Q2 2026. For the full year, S&P 500 earnings rise 10.8%, keeping valuations stretched: the forward 12-month P/E stands at 22.5, above both 5- and 10-year averages. Markets weigh this premium against the prospect of sustained double-digit earnings growth.
The Consumer
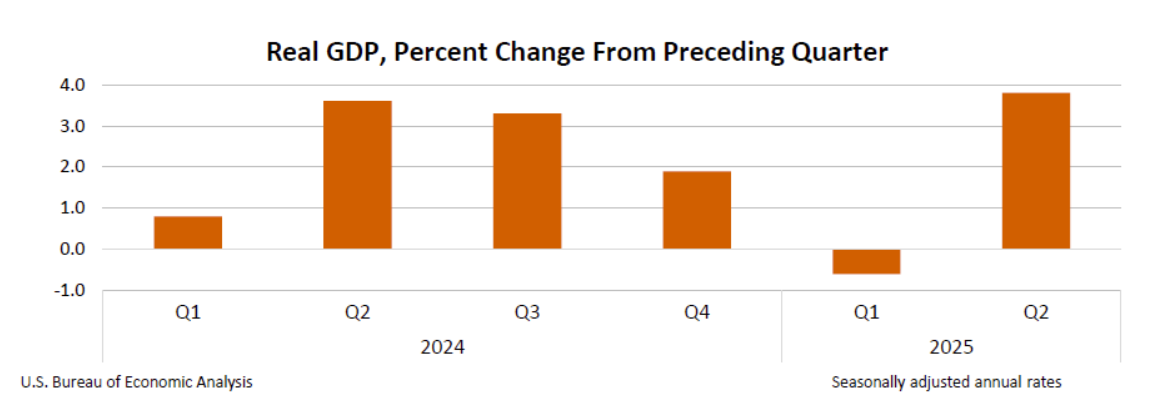
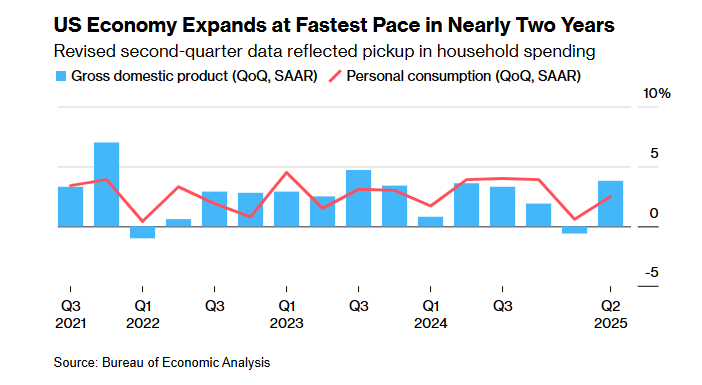
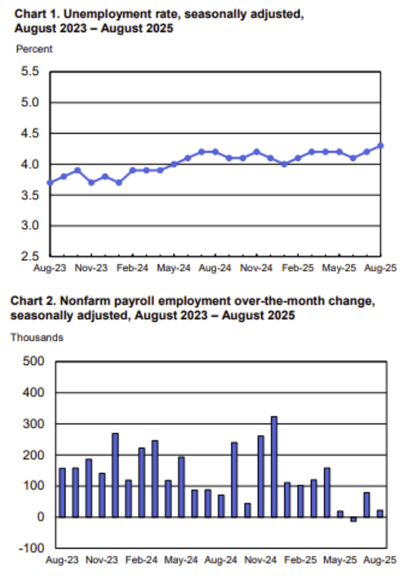
With monthly unemployment rates peaking for the first time in 2 years following a rapid pick-up in household spending between Q1 and Q2, economic data are sending mixed signals around the strength of the consumer.
Labor Markets
The US Government is currently in the midst of a shutdown, resulting in a delay of September jobs numbers, originally scheduled to be released on October 3rd. We will update this section with September jobs numbers after the shutdown ends.
August unemployment numbers were little changed, gaining 22,000 in nonfarm payroll employment, while the youth unemployment rate increased by 1% nominally from July. Youth unemployment rate can be seen as a leading indicator on employment and broader economic growth as the youngest employees are the first to be hired or fired. Average hourly earnings for all private, nonfarm employees rose by 0.3% for a year-over-year increase.
The Bureau of Labor Statistics also revised March’s job opening numbers down by just under a million – indicating a slightly weakening workforce before President Trumps tariffs were revealed.
Just this week, the ADP released weak jobs growth numbers with payrolls tracking a 32,000-job drop in September. The ADP’s numbers are not an accurate reflection of the state of the labor market, and we will keep you updated on September job numbers coming out of the BLS.
Corporations
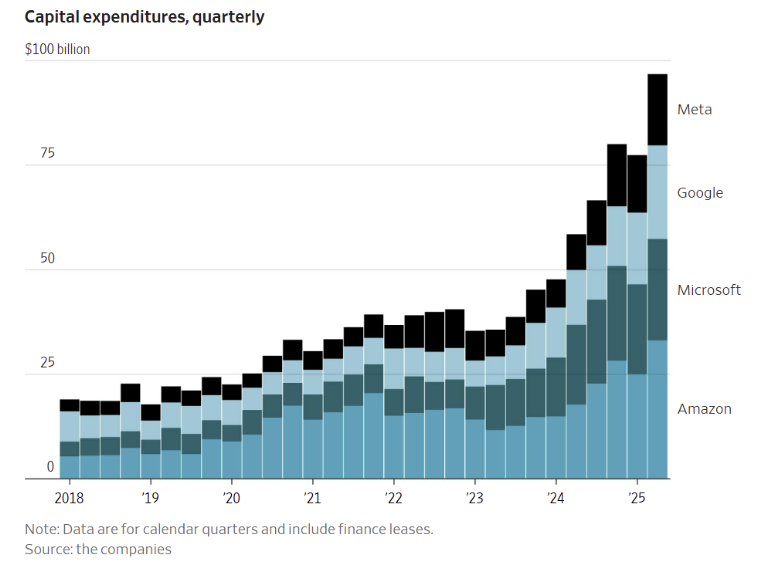
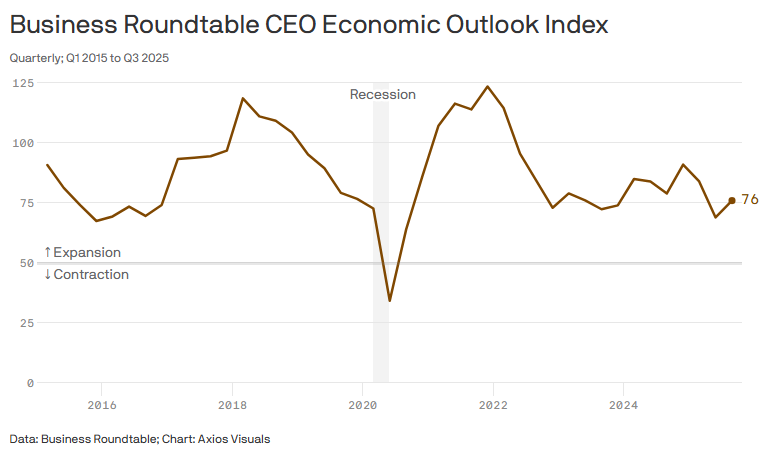
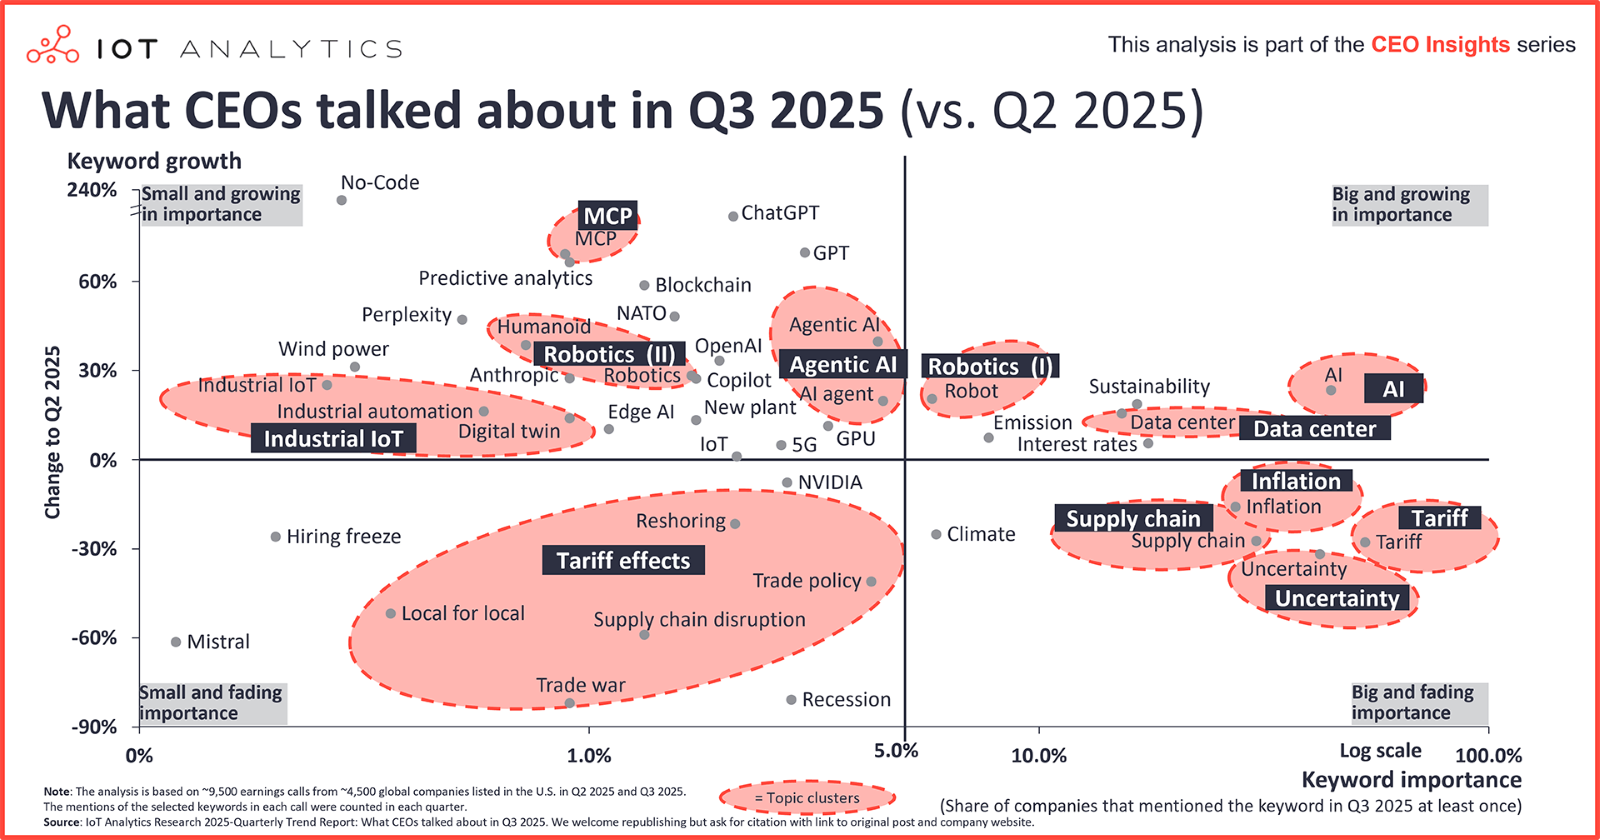
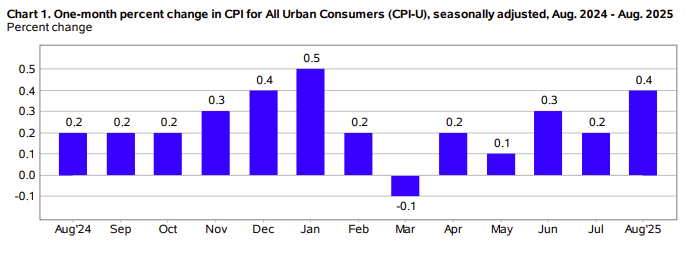
However consumers feel about the market isn’t reflected in the eyes of US corporations. Artificial intelligence and a recovery in capital expenditures provides a stronger basis for growth and stability among companies, with price hikes passed onto consumers, as denoted by the increase in CPI and decrease in PPI in August. CEOs polled by Axios’ Business Roundtable have a 76 score on their Economic Outlook Index, up from a Q2 drop we haven’t seen since the end of the pandemic.
The Wall Street Journal, 7/31/2025
“A record share now plan workforce reductions, and 93% are turning to AI or automation to offset rising costs, while most expect to pass price hikes on to consumers,” (Fortune).
Your Title Goes Here
Policies
Tariffs
Trump’s tariffs released on Liberation Day have come down significantly through ongoing trade agreements. The direct effects of the tariffs on corporations and consumers is yet to be fully reflected in the inflation data.
US Investments in Corporate Stock
Intel: The US govt announced that it will make an $8.9B investment in Intel common stock, backed by several other tech CEOs .
Lithium Americas Corp.: The US government announced that it will take a 5% equity stake in Lithium Americas Corp x GM. Lithium is a key component of electric batteries that power hybrid vehicles, among other devices.
Interest Rates
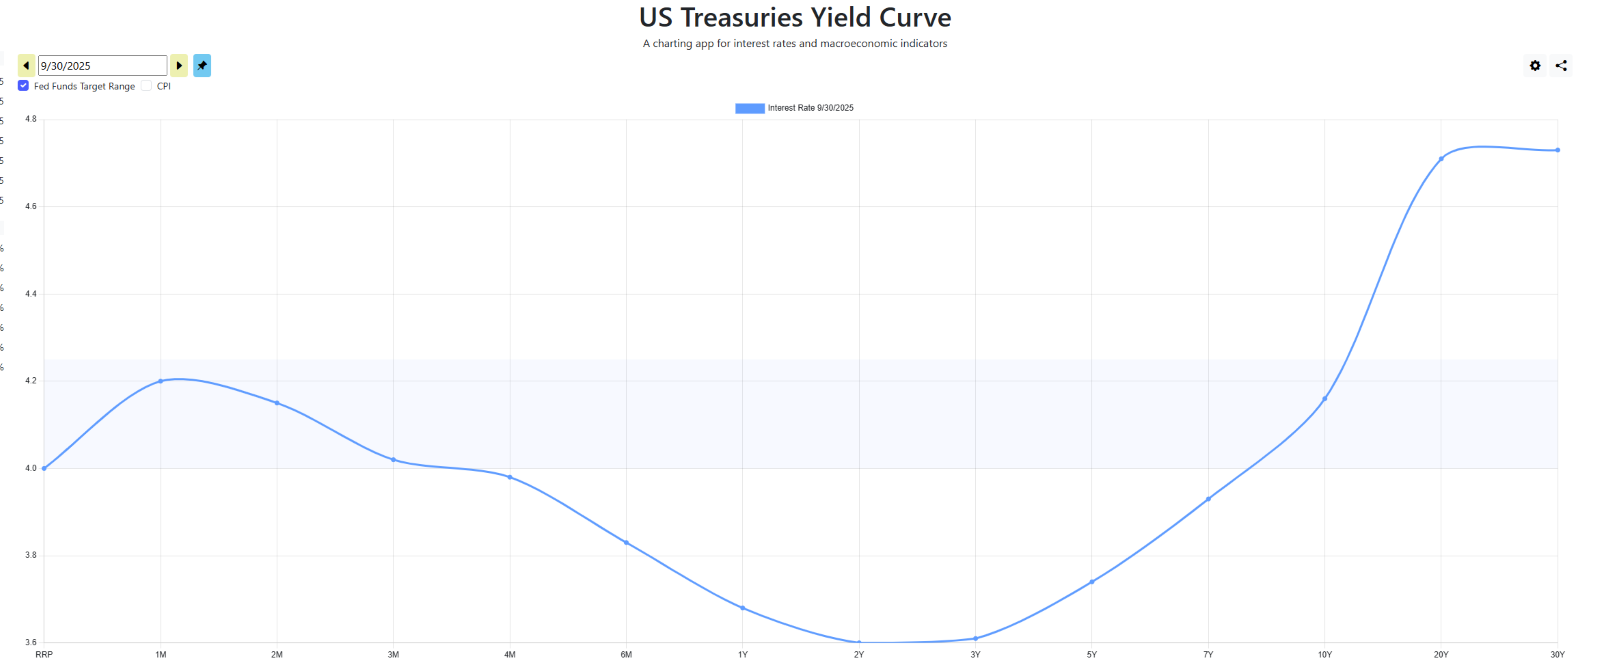
The Fed cut IR a quarter point in September, but long-term rates including 10Y Treasury, Mortgage rates went up as bond traders sold.
On Burnham’s Radar
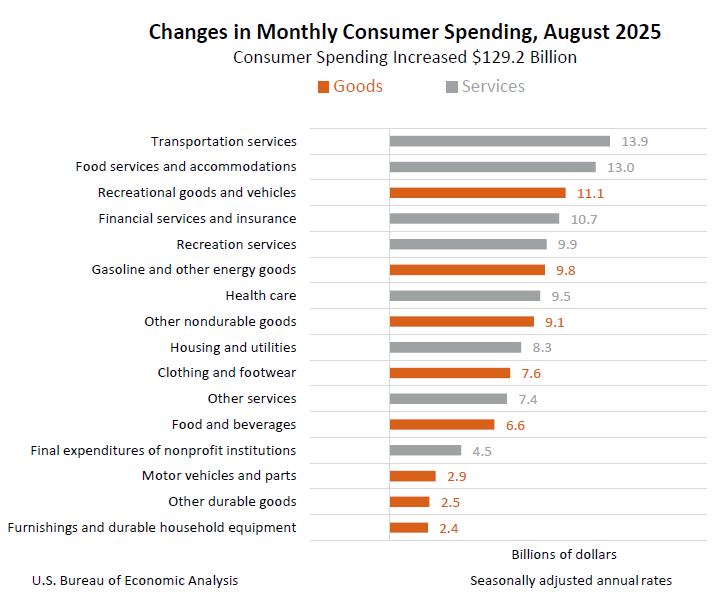
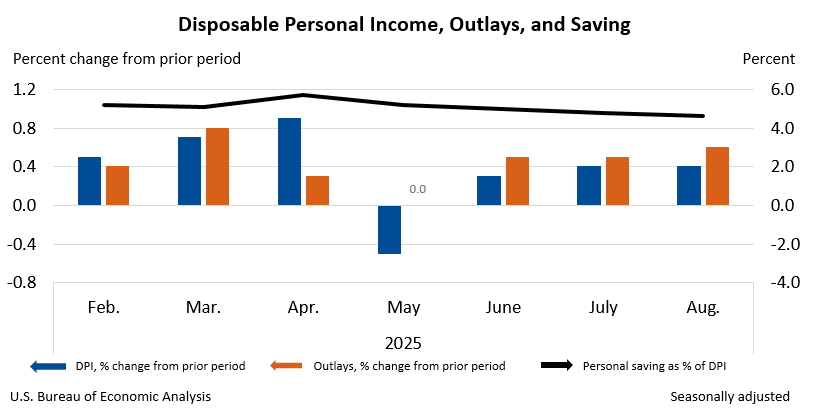
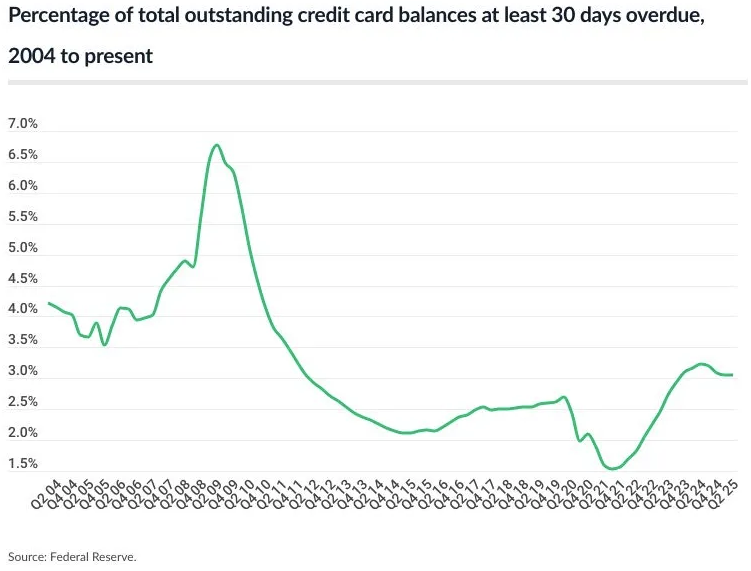
We’ve seen an increase in consumer spending over recent weeks as we head into the holiday season. It’s important to keep in mind that the top 10% of earners in the US make up roughly 50% of all spending, showing a discrepancy between economic indicators and the reality of the working class. As seen below, credit card debt has reached record highs, with delinquencies following a similar trend. We’ll keep an eye on how generational wealth transfer will affect this discrepancy.
Bureau of Economic Analysis, 9/26/2025
Bureau of Economic Analysis, 9/26/2025
Consumer’s Balance Sheet – Credit Card Debt
In Q3 2025, U.S. households continued to feel the weight of record-high credit card balances. Total balances remained near $1.21 trillion, with delinquencies edging higher across all borrower groups. What was once viewed as a lower-income challenge has now spread broadly, with even higher-income households reporting greater difficulty in managing monthly payments.
Hard data confirmed the trend. As of mid-2025, 12.27% of credit card accounts were 90+ days past due, well above the 10.93% level recorded a year earlier.
Surveys mirrored the stress on households. The National Foundation for Credit Counseling reported that by late summer, 13% of consumers had made a payment below the minimum, up from 8% in the spring. Balance transfers and personal-loan consolidations also rose, highlighting efforts to buy time in the face of higher borrowing costs.
Lenders reacted cautiously. The Federal Reserve’s Senior Loan Officer Opinion Survey noted continued tightening in credit standards through Q3, restricting access to new credit lines just as demand for relief increased. Taken together, Q3 2025 underscored a clear picture: consumer credit card debt remained at historic highs, serious delinquencies ticked upward, and access to credit became more constrained. These dynamics suggest that while households continued spending through the quarter, financial stress was building beneath the surface.
Delinquencies are also creeping higher. As of Q3, 3.05% of balances are at least 30 days past due, nearly double the pandemic-era lows but still well below the 2009 peak of more than 6.5%. This suggests that while most Americans are still managing to pay, the cracks are widening. Rising balances, stubborn inflation, and elevated interest rates are testing household budgets — and unless income growth accelerates, the risk of more consumers falling behind is likely to grow through the rest of 2025.
Click below for a live clock.
Geopolitical Risks & Opportunities
Russia – China – India Meeting: This is one of few meetings where the US was excluded from global talks, suggesting a potential realignment. For the US investor, this just creates more opportunity for diversification in global markets away from US and US-adjacent assets.
Israel and Qatar: Instability in the Middle East was amplified by Israel’s attack on Qatar, but tensions between the US and Israel and Iran have simmered since the US’ attack in June.
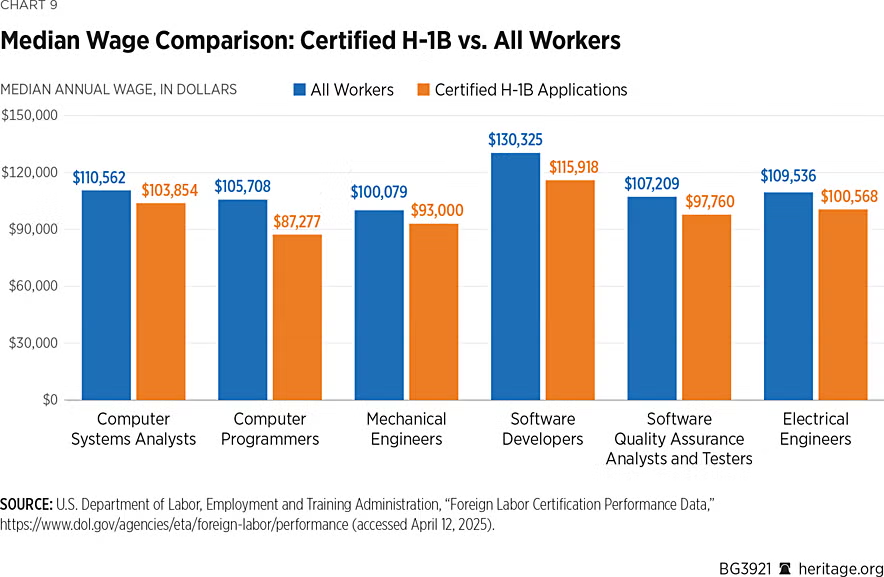
Gold Card and H-1B Visa: The H-1B visa is just one of many options for foreign talent to live and work in the US. The increase from $5,000 to $100,000 to companies looking to sponsor this visa to foreign employees means a more restrictive system of recruitment in the hopes of recruiting more US citizens and residents. However, the current youth unemployment rate, for example, factors in both domestic and foreign workers, so we have yet to see how this will affect broader economic trends.
Additionally, President Trump introduced the Gold Card to allow another path to permanent residency – through a $1M fee, now decreased from $5M. This could be another revenue generator for the US government, depending on the uptake.
Commodities
As the third quarter of 2025 ends, precious metals held firm on safe-haven demand, while energy and base metals weakened under supply growth and soft demand.
Energy and Oil
- Oil prices fell on rising supply and weaker demand. Brent crude is projected to average about 67 dollars per barrel in 2025, with West Texas Intermediate near 64 dollars. The World Bank energy price index dropped 3.9 percent in August.
Precious Metals
- Gold remains supported by inflation and growth concerns, though forecasts diverge.
Base and Industrial Metals
- Weak industrial activity, especially in China, pressured base metals, though easing monetary policy and potential stimulus may help. Battery metals such as lithium are expected to stay supported by tight supply.
Agriculture and Soft Commodities
- Weather continues to drive agricultural markets, particularly in the United States and Brazil. Cocoa remains high on West African supply shortages, while sugar and coffee are stabilizing with harvests.
Going into the fourth quarter, key themes are volatility, sector divergence, supply constraints in metals, macroeconomic feedback into inflation and policy, and weather-driven risks in agriculture.
SwitzerDaily, Bloomberg, 9/24/2025
Government Spending and Deficits
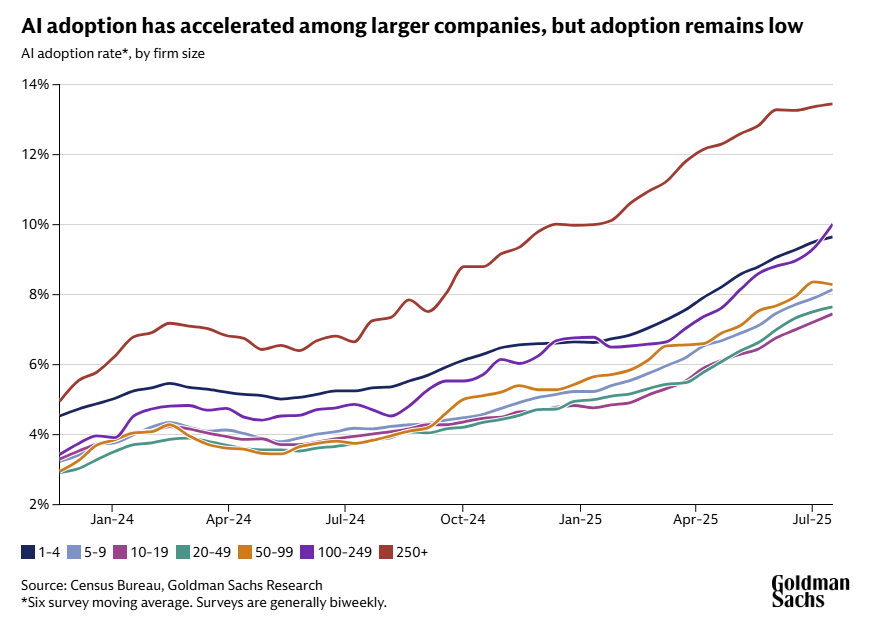
U.S. deficit is projected at $1.9 trillion for FY 2025, with debt expected to exceed 100% of GDP as rising entitlement costs and higher interest payments strain finances. At the same time, AI adoption is accelerating among large firms but remains below 10% in smaller businesses, suggesting uneven disruption. Like the internet boom of the 1990s, AI is likely to shift demand away from routine work toward new roles in development, training, and support, making workforce adaptation critical.
Fiscal Snapshot – Q3 2025
The U.S. federal deficit is projected at $1.9 trillion (6.2% of GDP) for FY 2025, keeping Washington on an elevated borrowing path. Total federal spending is running above $6.6 trillion, while revenues—though improving—remain insufficient to close the gap.
Trends & Drivers
Mandatory outlays, especially Social Security, Medicare, and Medicaid, continue to expand with demographic and healthcare pressures. Interest costs are rising sharply as debt is refinanced at higher yields, making debt service one of the fastest-growing budget items. Discretionary spending has held steady at elevated levels, and tariff revenues have provided some cushion but aren’t large enough to materially shift the long-term outlook.
Outlook & Risks
Federal debt held by the public is on track to surpass 100% of GDP by year-end, with projections pointing higher over the next decade. Persistently high deficits leave the fiscal position exposed—if growth slows or interest rates rise further, debt dynamics could worsen quickly. Investors and policymakers alike are watching closely as fiscal sustainability risks edge back into focus.
Artificial Intelligence
- Larger companies, (those with 250 or more employees) are seeing a much greater adoption of artificial intelligence than its smaller counterparts, with small to mid-sized companies still seeing adoption rates below 10%.
-
- Smaller and medium-sized companies may be the way to go for job security
- They may not have the money to replace people with AI
- This may bode for a more open economy, decentralizing larger companies and bettering competition.
We don’t have all the answers, and the journey AI could take us on is blurry at best. But we do have a relatively recent reference point for this level of technological advancement: the dawn of the internet.
When the internet started to gain traction in the workplace in the late ‘90s and early ‘00s, we saw a similar flocking to trade and non-automated jobs that we see today. Construction, direct-to-patient healthcare, cleaning services and more are all examples of positions that may be less likely to disappear with the introduction of AI due to their manual nature.
But one segment of the early 00’s data revealed that job availability in the computer and data science sector of engineering spiked. While jobs that became automated saw a dip, jobs surrounding the training, development, and support of emerging internet and computer technologies grew. Today, we may see a similar adjustment to the workforce skillset.
Top Industries Seeing Job Loss Due to AI (Digital Defynd)
- Manufacturing: Over 1.7 Million Jobs Lost Globally Due to AI-Driven Automation
- Retail: 52% of In-Store Tasks Now Automated, Displacing Thousands of Entry-Level Jobs
- Transportation: AI Could Eliminate Up to 94% of Driving Jobs in the Coming Decades
- Customer Service: 80% of Routine Inquiries Now Handled by AI Chatbots
- Banking & Finance: 1 in 3 Roles in Transaction Processing Replaced by AI
- Legal Services: 39% of Document Review Tasks Now Performed by AI Tools
- Journalism: Up to 30% of Financial and Sports News Is Now AI-Generated
- Telemarketing: AI Systems Now Handle 87% of Outbound Customer Calls
- Travel & Tourism: 72% of Travel Bookings Now Done Without Human Agents
- Human Resources: 43% of Screening Interviews Are Now AI-Driven
Private Markets
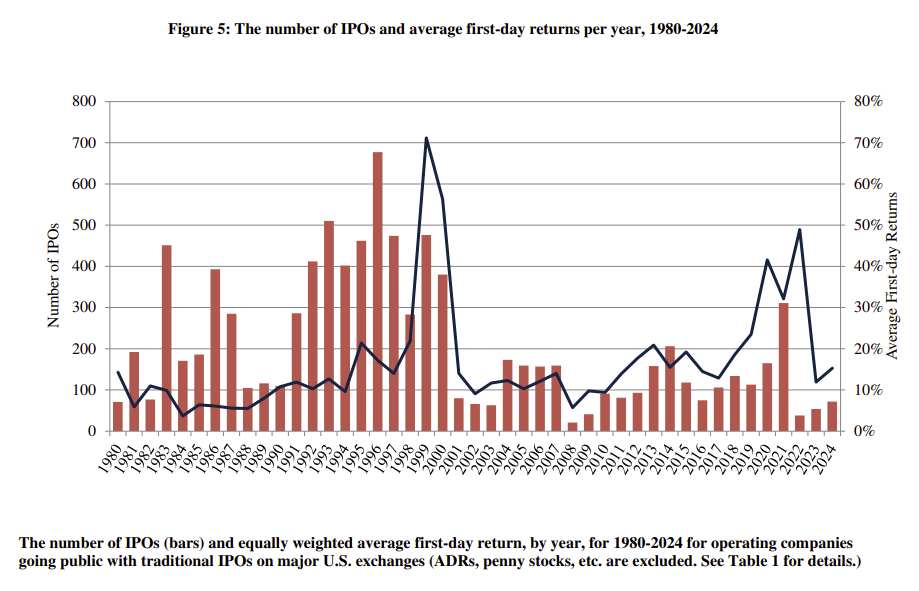
The change-up in industry leaders over the past several decades, with the technology sector taking on a significant lead with higher concentration in the Mag-7, has accompanied a halving of IPOs from the late ‘90s.
Goldman Sachs, 8/13/2025
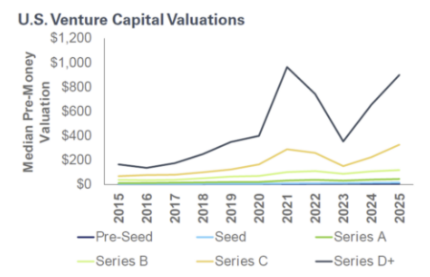
Privatization is the new norm, with smaller profitability at time of IPO for those tech companies choosing to go the retail fundraising route. Buyouts have dropped as of March 2025, but a recent spike in pre-seed Venture Capital investments is a leading indicator for private market investment.
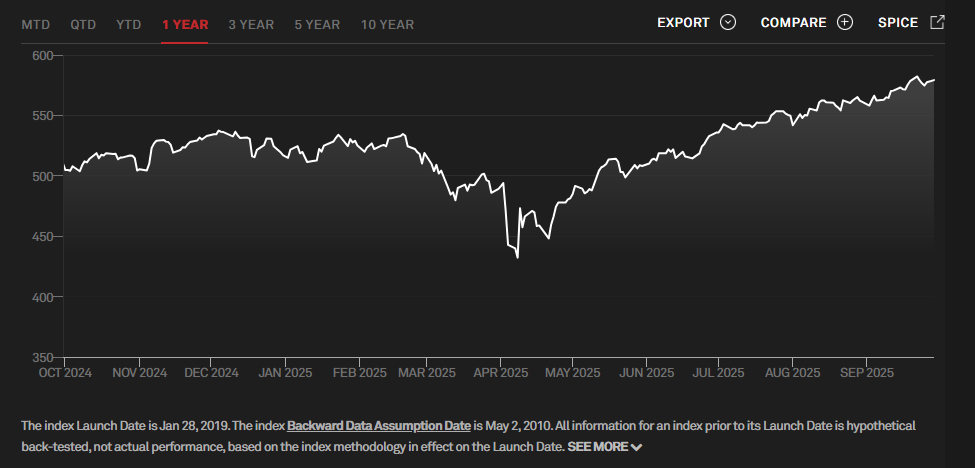
As a reminder, most times it is best to ride out the ebbs and flows that the market experiences. Investors who bought on Jan. 1, 2025 and sold during the Liberation day volatility would’ve experienced a realized loss of <15.09%> versus staying the course and being up 14.3%, a 29.39% swing.
S&P Global, 9/30/2025
What we read/watched/listened to this quarter
“Wealth goes beyond money and includes how you live. Time wealth means controlling your schedule and choosing how you spend your days. Social wealth comes from building strong, meaningful relationships. Mental wealth is about purpose, growth, and reflection. Physical wealth depends on caring for your body with movement, nutrition, and rest. And financial wealth supports it all through stable income, smart spending, and investing.” – James M. Corrigan, CFP, CPWA
“Mark Bertolini, former CEO of Aetna and current CEO of Oscar Health, shares how a near-fatal ski accident transformed his leadership approach. He discusses how his personal struggle with chronic pain and medical trauma shaped his commitment to employee health, including bold wage decisions that ultimately boosted shareholder returns.” – Sean M. Jucas, CFP, CPWA, SE-AWMA
“Explores how chance and luck play a much larger role in success, failure, and everyday outcomes than most people realize. Drawing on examples from finance, history, and life, Taleb shows how humans misinterpret randomness as skill, leading to overconfidence and flawed decision-making.” – David Holtkamp, CFA, CFP, CPFA
“Burton argues markets are mostly efficient, meaning stock prices already reflect available information. The book emphasizes long-term, passive investing—over trying to time the market or pick winning stocks. It also walks through different investment strategies, bubbles, and fads, showing why most fail compared to disciplined, diversified investing.” – Basel Alwawi
“AI Bubble Watch: Has the Hype Gone Too Far? Josh Brown and Ed Elson explore recent tech sell-offs and question whether the AI frenzy is tipping into bubble territory. They also debate the role of diversification, the entrance of private funds into 401(k) plans, and where the Federal Reserve is headed.” – Iris Swarthout
Registered Representatives of Sanctuary Securities Inc. and Investment Advisor Representatives of Sanctuary Advisors, LLC. Securities offered through Sanctuary Securities, Inc., Member FINRA, SIPC. Advisory services offered through Sanctuary Advisors, LLC, an SEC Registered Investment Advisor. Burnham Harbor Private Wealth is a DBA of Sanctuary Securities, Inc. and Sanctuary Advisors, LLC.
No representation is made as to the accuracy or completeness of information contained herein. The information is based upon data available to the public and is not an offer to sell or solicitation of offers to buy any securities mentioned herein. Any forward-looking statements are based on assumptions, may not materialize, and are subject to change without notice. Any investment discussed may not be suitable for all investors. Investors must make their own decisions based on their specific investment objectives and financial circumstances. Investments are subject to risk, including but not limited to market and interest rate fluctuations. Any performance data represents past performance which is no guarantee of future results.

