



A Market Defined by Shock and Structural Change
The first quarter of 2026 was shaped by the convergence of two powerful forces, one cyclical and immediate, the other structural and long-term. On one hand, markets were jolted by a sudden reintroduction of geopolitical risk. Escalating tensions in the Middle East and the disruption of oil flows through the Strait of Hormuz drove a sharp rise in energy prices, reigniting inflation concerns and increasing near-term market volatility. This external shock forced investors to reassess the stability of what had otherwise been a resilient economic backdrop.
At the same time, a quieter but more profound shift continued to unfold beneath the surface. The software industry is moving rapidly from AI experimentation to active implementation, with companies increasingly using AI to replace, not just augment, human labor. This transition has already resulted in meaningful workforce reductions, particularly in entry-level and operational roles, while accelerating demand for highly specialized AI talent.
These dynamics are creating a market with competing narratives. In the near term, higher energy prices and geopolitical uncertainty introduce volatility and inflation risk. Over the longer term, however, AI-driven productivity gains have the potential to be disinflationary, lowering costs and reshaping how businesses operate.
As a result, the quarter was less about a breakdown in economic fundamentals and more about a repricing of risk across multiple dimensions. Investors are now navigating both the immediate impact of geopolitical disruption and the longer-term implications of a rapidly evolving technological landscape, one that is likely to redefine growth, labor, and corporate profitability in the years ahead.
Key Portfolio Adjustments in Q1
Trade Rationale | As of March 12, 2026
A Tune-Up, Not a U-Turn
The below is based on your discretionary managed portfolios.
Our view on the market hasn’t changed, we still see a constructive backdrop for growth, earnings, and continued disinflation. Markets are shifting, however, and we made a series of targeted adjustments to keep our portfolios well-positioned for what comes next.
Here’s what we did and why:
We trimmed, not retreated. We kept our equity overweight in place but reduced some of the more concentrated bets, locking in gains where positions had run hard and broadening the risk base.
We got more selective on AI. The AI theme is alive and well, but the easy, broad-based gains are behind us. We moved from passive exposure to mega-cap tech toward active strategies focused on companies genuinely monetizing AI, the ones seeing real margin and productivity improvements. We expect bigger performance gaps to open up across semis, software, and adopters.
We made modest regional adjustments. We trimmed U.S. and Emerging Markets slightly, both had strong runs, and nudged our international developed markets allocation closer up to neutral (Europe, Japan, etc). No major conviction shifts, just sensible rebalancing.
We upgraded our bonds. With credit spreads near all-time tights, lower-quality debt simply isn’t paying enough to take the risk. We shifted toward higher-quality, longer-duration bonds, the kind that actually hold up when equity markets get choppy.
We added defense, took profits on gold and lowered allocation by 2%. Defense spending is a multi-year global story with strong visibility. Gold has done its job for now, we trimmed after a solid rally, though we maintain a long-term position.
The short version: we’re still optimistic, just more precise about how we’re expressing it.
The portfolios are built for a market that rewards breadth and discipline, which is exactly where we think we’re heading.
To learn more give us a call.
Q1 Recap
The markets saw a drawback amid geopolitical tension:
- Real Estate was the best performing asset class for the quarter (+3.8%), followed by Small Cap and Cash (Novel investor, 3/31/2026).
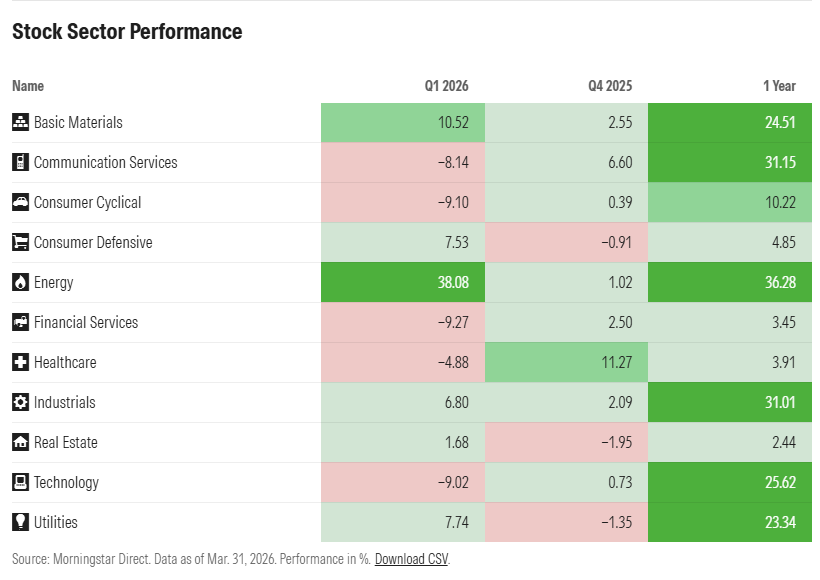
- Energy was the best performing sector, up over 38 percentage points from the previous quarter.
- Biggest drops from the previous quarter were in Tech, Healthcare, and Communication Services (Morningstar Direct, 3/31/2026).
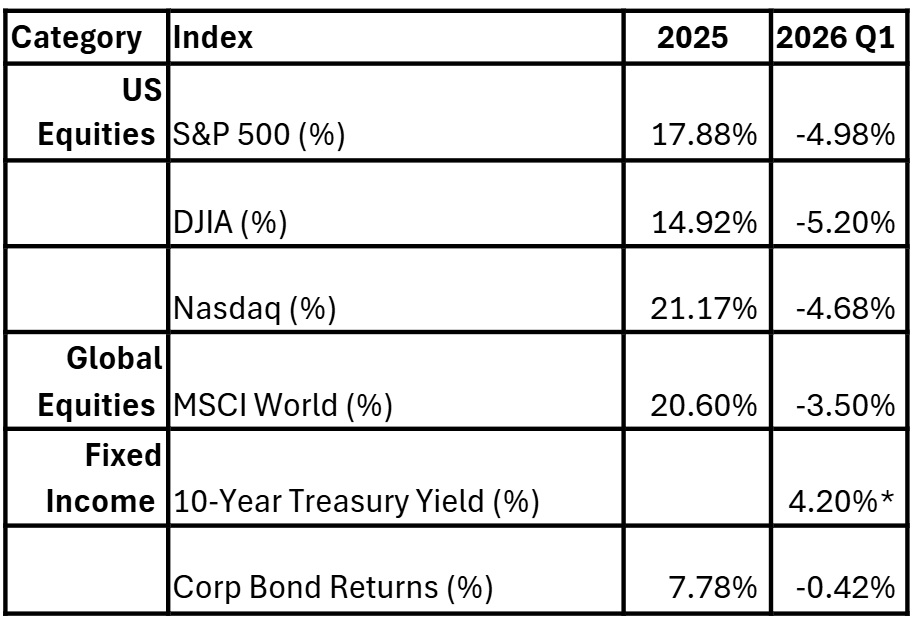
BofA Global Research – US Performance Monitor, 4/02/2026
The leading economic index is typically our telltale signal of economic strength for the months and years ahead.
The Current Landscape
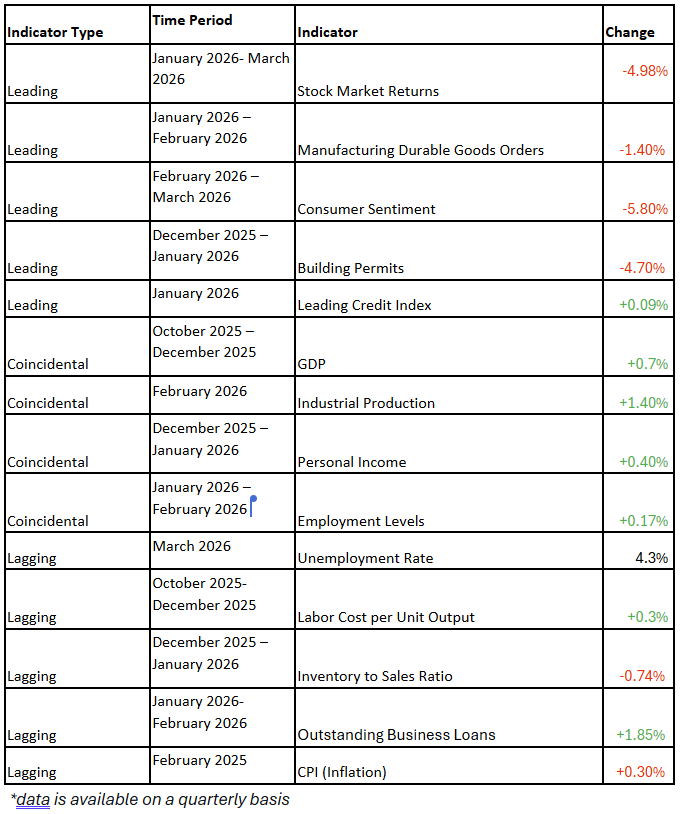
Federal Reserve Economic Data, Bureau of Economic Analysis, The Conference Board, The University of Michigan Consumer Sentiment, Bureau of Labor Statistics.
Recession Probabilities
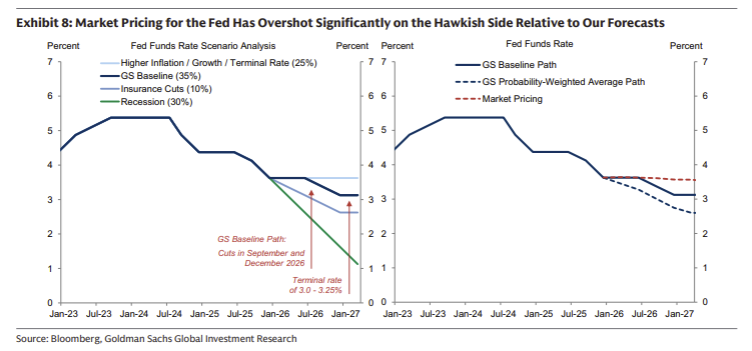
Per the below, Goldman Sachs has nudged up their 12-month forward probability of a recession to 30%, back to where it was for most of 2025H2. A recession is not the base case, but the probability is higher now versus January 2026 due to below-trend growth and higher forecasts for PCE inflation.
Goldman Sachs is targeting two 25bps interest cuts (in September/December) as reasonable given their outlook for employment and core inflation. While the risks are two-sided, the bigger tail is a recession or near-recession that triggers more aggressive cuts.
Earnings
Q4 Earnings and Q1 Expectations: By the Numbers
Earnings results remain strong following the close of Q4. The S&P 500 delivered approximately 13.0% year-over-year earnings growth, marking another quarter of double-digit expansion, while revenue growth came in near 8.8%, supported by continued strength in technology and resilient consumer demand.
Earnings momentum has continued into the new year. For Q1 2026, the S&P 500 is projected to grow earnings by ~12.5% year-over-year, which would mark a sixth consecutive quarter of double-digit gains. While revisions have been mixed across sectors, upward adjustments in Technology and Financials have helped offset weakness in areas such as Health Care, pointing to a broadening but still uneven earnings cycle.
- Technology: Technology was the standout sector in Q4 2025, posting 33.5% year-over-year earnings growth, the highest of all eleven sectors, alongside 21.6% revenue growth. 93% of companies in the sector beat EPS estimates and 91% beat revenue estimates. By mid-March, FactSet had lifted the sector’s Q1 2026 earnings growth estimate to 44.8%, up from 34.3% at December 31, with Information Technology also showing the largest increase in dollar-level earnings estimates since the start of the quarter.
- Financials: Financials turned in a solid Q4 2025, with 8.1% earnings growth and 9.5% revenue growth. The sector’s Q4 earnings growth rate had improved from 6.4% at year-end to 9.3% by late February on the back of positive EPS surprises from companies such as Allstate and Goldman Sachs. Over 60% of Financials companies beat EPS and revenue estimates. For Q1 2026, Financials expected earnings is at 14.5%. It is also worth noting the sector has the lowest forward 12-month P/E ratio at 14.2, reinforcing its value appeal.
- Communication Services: Communication Services delivered another strong quarter, with 12.8% earnings growth in Q4 2025 in the March report, paired with 12.5% revenue growth, the second-highest revenue growth rate among sectors. 74% of companies beat EPS estimates and 87% beat revenue estimates. For Q1 2026, Communication Services is still expected to be one of the better-performing groups, with 12.8% expected earnings growth and sector revenues again among the market leaders.
- Utilities and Materials: Materials was one of the stronger cyclical performers in Q4, reporting 11.3% earnings growth, while Utilities posted a more modest 3.9% earnings growth. On the revenue side, Utilities was especially strong at 9.7% in the March report and 10.2% in the February report, while Materials posted 3.6% revenue growth; in Q4, 50% of Materials companies beat EPS estimates compared with 65% in Utilities. Looking ahead to Q1 2026, Materials is expected to accelerate sharply to 24.4% earnings growth, second only to Technology, while Utilities’ Q1 EPS estimate was unchanged from December 31 through late February, suggesting a steadier but less explosive backdrop.
- Health Care: Health Care was one of the weakest earnings sectors in Q4 2025, showing just 0.5% earnings growth in the March report, even though revenue growth was a healthy 10.4%. FactSet’s earlier February report had shown broad revenue strength across all five Health Care industries, but by March the Q1 picture had deteriorated: the sector had seen the largest percentage decrease in estimated dollar-level earnings since December 31, down 11.4%, and the Q1 2026 earnings outlook swung to a projected -8.7% decline from an expected +3.1% gain at year-end.
- Energy & Consumer Staples: Energy remained soft in Q4 2025, with just 0.9% earnings growth and -0.5% revenue growth, the weakest revenue result of any sector. FactSet tied this weakness to lower oil prices, noting the average price of oil in Q4 2025 was $59.14, down 16% from $70.09 a year earlier. Consumer Staples was steadier, posting 3.3% earnings growth and 5.3% revenue growth, but sentiment remains subdued.
- Looking Ahead: Expected Q1 2026 S&P 500 earnings growth is currently at 12.5% and revenue growth is at 9.6%, which would mark the sixth straight quarter of double-digit earnings growth if realized. Eight sectors are expected to post year-over-year earnings growth, led by Information Technology, Materials, and Financials, while the three sectors expected to decline are led by Health Care. For full-year 2026, analysts are projecting 16.3% earnings growth for the S&P 500, while the forward 12-month P/E has eased to 20.3 from 22.0 at year-end, suggesting the market is still priced above historical averages but less stretched than it was entering the year (Factset, February and March 2026).
The Consumer
Consumer sentiment fell to 53.3 in March, revised downward from the 55.5 estimate and nearly 3 points lower than January and February’s numbers. According to Trading Economics, factors including rising gas prices contribute to the drop in sentiment, with households with middle and higher incomes experiencing the largest drops in confidence. The Y-Y change in March 2026 fell by 2.6% (University of Michigan Consumer Sentiment). In 2025, consumer sentiment hit a low of 51 in November.
Labor Markets
Nonfarm payroll employment increased by 178,000 in March, unemployment rate changed little at 4.3%. Gains were seen in health care following strikes, construction, and transportation, among others, while federal jobs continued to decline. Jobs in social assistance especially in family services increased in March, while financial activities employment fell by 77,000 since its peak in May 2025. Average hourly earnings increased steadily and by $1.27 from March 2025.
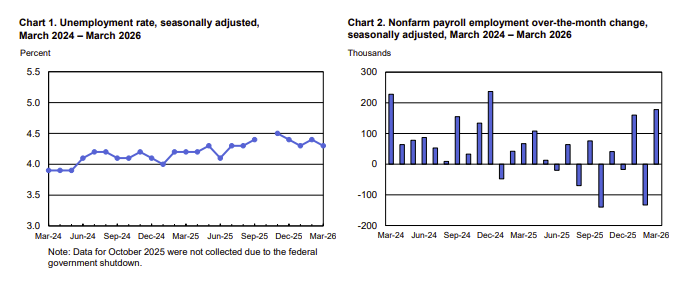
Bureau of Labor Statistics, 4/3/2026
Corporations
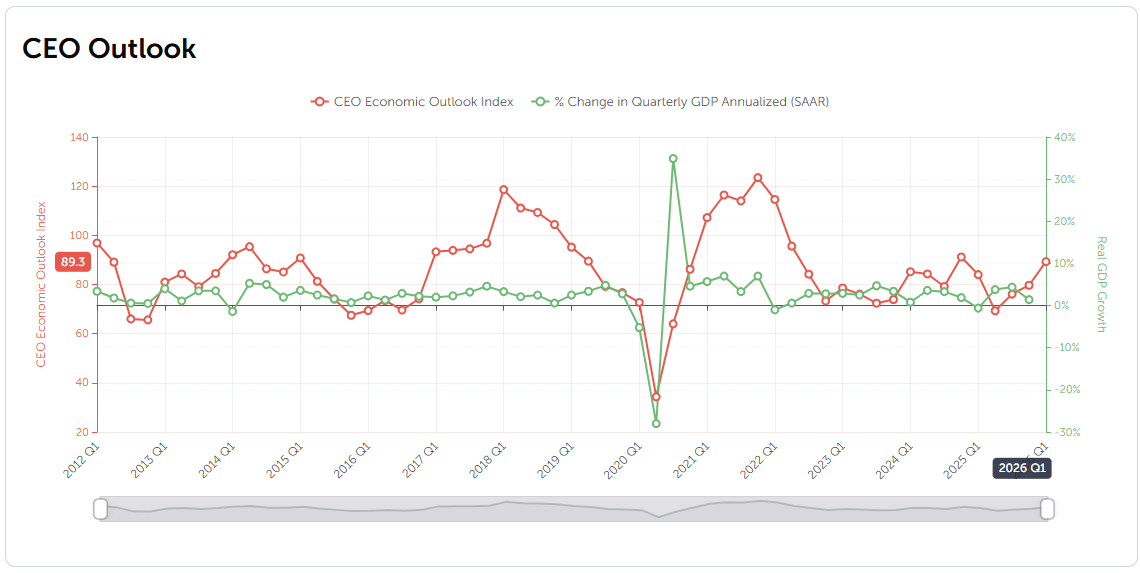
Results of a survey of CEOs within the Business Roundtable taken between February 23 and March 6th 2026 were surprisingly positive, indicating a potential mellowing of expectations for the Iran war. The index below is a composite for capital spending and employment expectations of the next six months (Business Roundtable).
Note that most layoffs occur at the end of the fiscal year and into the new year, so part of that employment increase could be attributed to the hiring cycle (Fast Company, 12/21/2023). Sales saw the lowest expectations increase, while capital spending seeing the highest – all while investment in AI is continuing to rise, with now over 80% of Fortune 500 companies actively using AI in their workplaces (Built In, 3/26/2026).
Business Roundtable
Policies
Trump Account Updates
As of 4/6/2026: For children or grandchildren under the age of 18, parents of American citizens can enroll their children in a Trump account by getting their Form 4547 filled out for tax election. If the child in question was born on 1/1/2025 or later, they are eligible to receive a $1000 seed into their Trump account once it is established. If the child was born before 1/1/2025 and is under the age of 10, they could be eligible for a $250 seed depending on if they reside in an area with a median household income of $150,000 and below.
Trump accounts will be housed with Bank of New York Mellon as the designated financial agent. As of March 31, more than 4 million children have been signed up for Trump accounts, with over 25% eligible for the $1000 contribution (CNBC, 4/6/2026).
Elevated tax refund
OBBBA allowed for a larger standard deduction in 2025, a boost to the child tax credit and a new deduction for those 65 and older. The latter can claim an additional $6k without itemizing deductions. The White House is forecasting a refund increase of $1k or more. While the expectation of this higher tax refund is stimulating for investments and spending, we’re unsure what that will look like for those at the higher end of the economic ladder controlling much of the economy (CNBC, 3/17/2026).
On Burnham’s Radar
401k/Credit Card/Buy Now Pay Later/Loans
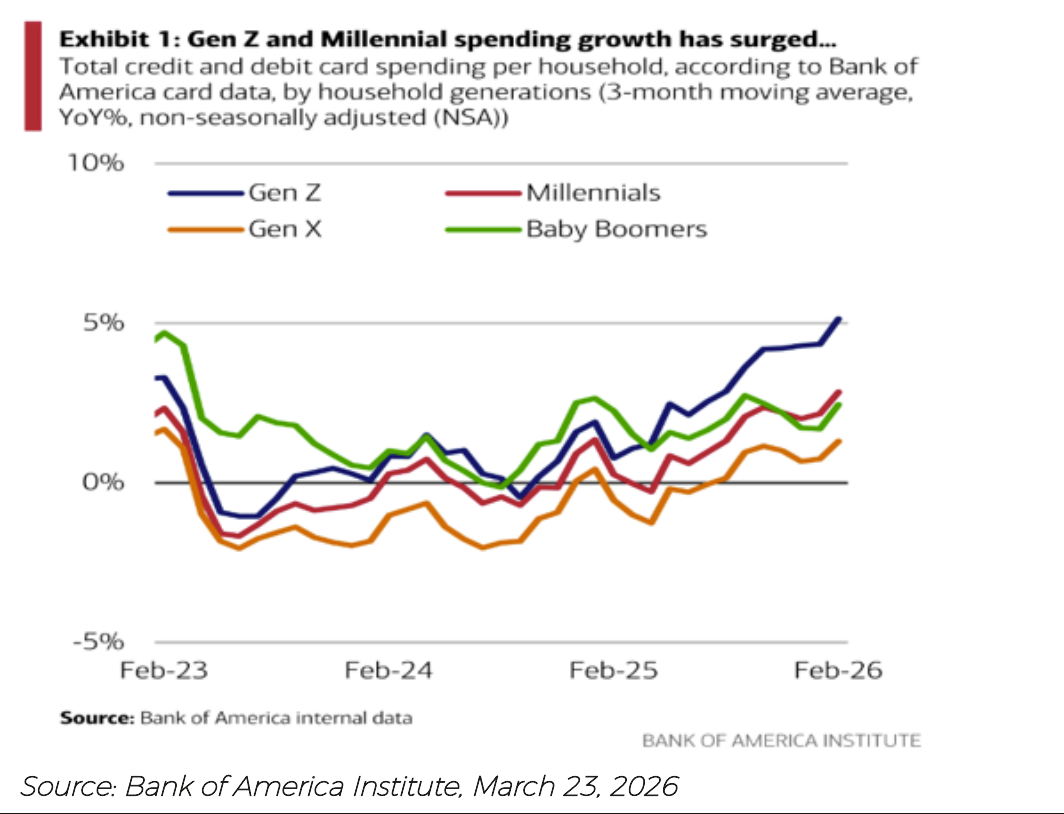
Margin lending can be stimulative in a slowing economy, and the rise of new types of lending in the form of Buy Now, Pay Later on everyday consumer goods and services, may have ripple effects across the spending landscape.
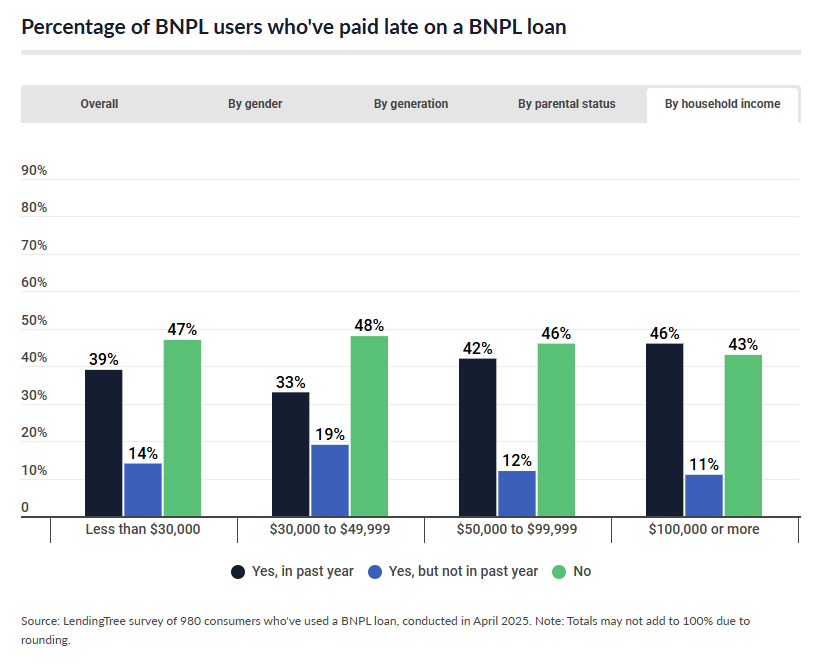
As of March 17th, 2026, Buy Now Pay Later users saw a 41% rate of late payments in the last year, up from 34% from the previous one, though 76% of late payers were late by no more than a week or so. High-income borrowers are most likely to pay late, indicating that late payments may be attributable to non-financial factors and the perception that BNPL does not contribute to credit score monitoring as much as credit card, mortgage, and other larger loans (LendingTree, 3/17/2026).
Interest Rates
Interest rates were held steady in March as a result of job gains remaining low and inflation remaining somewhat elevated, per the Federal Reserve. The target range for the Fed Funds Rate is between 3.5 and 3.25% (Federal Reserve, 3/18/2026).
According to Freddie Mac, the 30-year fixed-rate mortgage sits at 6.38% and the 15-year at 5.75% (as of March 26th, 2026). Both the 30-year and 15-year year-over-year rates have fallen. From the start of the year, the 30-year fixed-rate mortgage has increased by 0.22%.
Managing Partner Sean Jucas spoke to changing interest rates this quarter by alluding to the importance of making decisions with information beyond the spreadsheet.
“While lower rates may improve affordability, we caution against reacting to rate changes alone. We evaluate lifestyle stability, career flexibility, long term cash flow, and the opportunity cost of committing capital to a down payment,” Jucas said.
Inflation
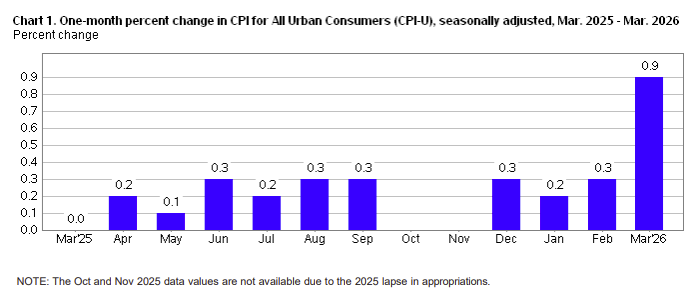
In March, the Consumer Price Index came in hot, increasing 0.9% on a seasonally adjusted basis. Energy prices that spiked after the Venezuelan President Maduro’s capture went down in Feb before the war in Iran broke out on February 28th. Thereafter, the index rose 10.9% in March, with a 21.2% increase in gas and 30.7% increase in fuel oil. Other points of increase included apparel, energy services, and new vehicles, while medical care commodities and used cars and trucks fell. (Bureau of Labor Statistics, 4/10/2026).
Bureau of Labor Statistics, 4/10/2026
Credit Card Debt and Lending
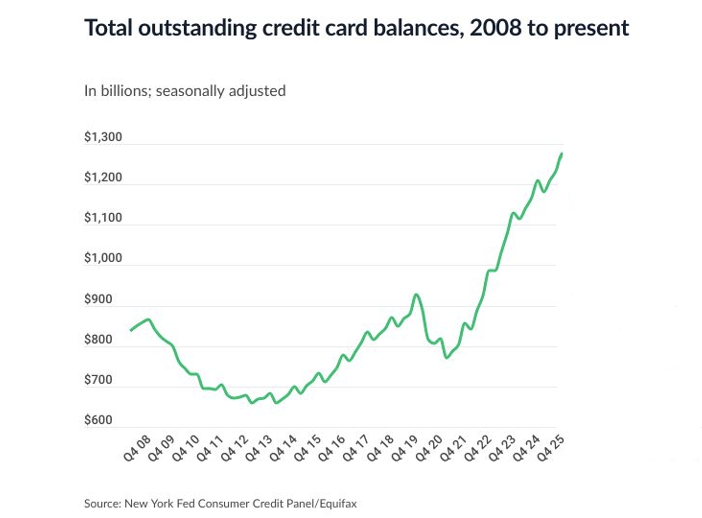
U.S. consumers entered Q1 2026 with credit conditions still relatively stretched, though showing early signs of stabilization. According to data from the Federal Reserve Bank of New York, total household debt reached approximately $17.9 trillion, with credit card balances hovering near $1.13 trillion, just below peak levels seen in late 2025. Average credit card interest rates remain historically high, exceeding 21% APR, according to the Federal Reserve, keeping debt servicing costs burdensome for many households (New York Fed Household Debt and Credit Report, Federal Reserve Consumer Credit Data).
Delinquency trends highlight growing strain among lower-income borrowers. The New York Fed reports that serious delinquency rates (90+ days past due) on credit cards rose to roughly 11–12%, with the sharpest increases concentrated among borrowers under age 40 (The Federal Reserve Bank of New York, 2/10/2026). At the same time, lending standards have tightened modestly, as shown in the Federal Reserve Senior Loan Officer Opinion Survey, where a net share of banks reported stricter credit card and consumer loan underwriting in early 2026. This combination of high borrowing costs and tighter access to credit suggests that marginal consumers are beginning to face more constraints.
Still, consumer spending has remained resilient. Data from the U.S. Census Bureau shows nominal retail sales rising approximately 3–4% year-over-year in Q1 2026, supported by wage growth and a still-healthy labor market. However, the growing divergence between income growth and borrowing costs raises risks heading into the remainder of 2026. If delinquencies continue to rise alongside elevated interest rates, consumer credit could shift from a tailwind to a headwind for broader economic activity (U.S. Census Bureau Retail Sales Data, Reuters, 2/10/2026).
Geopolitical Risks & Opportunities
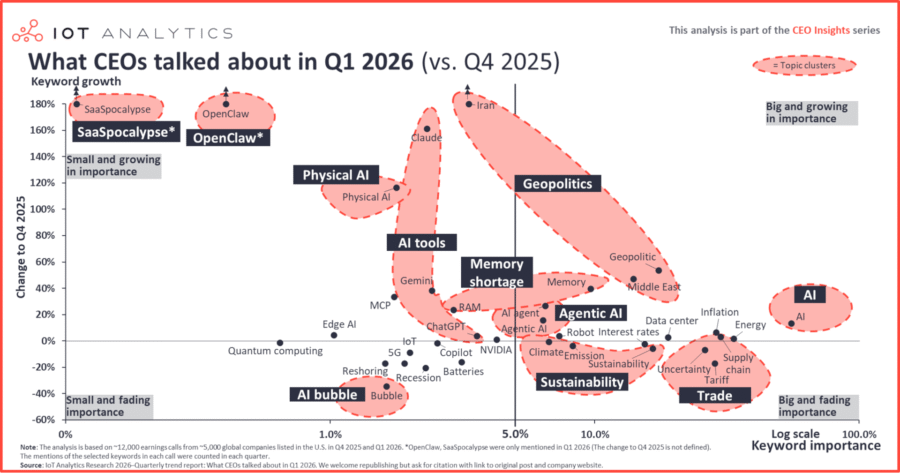
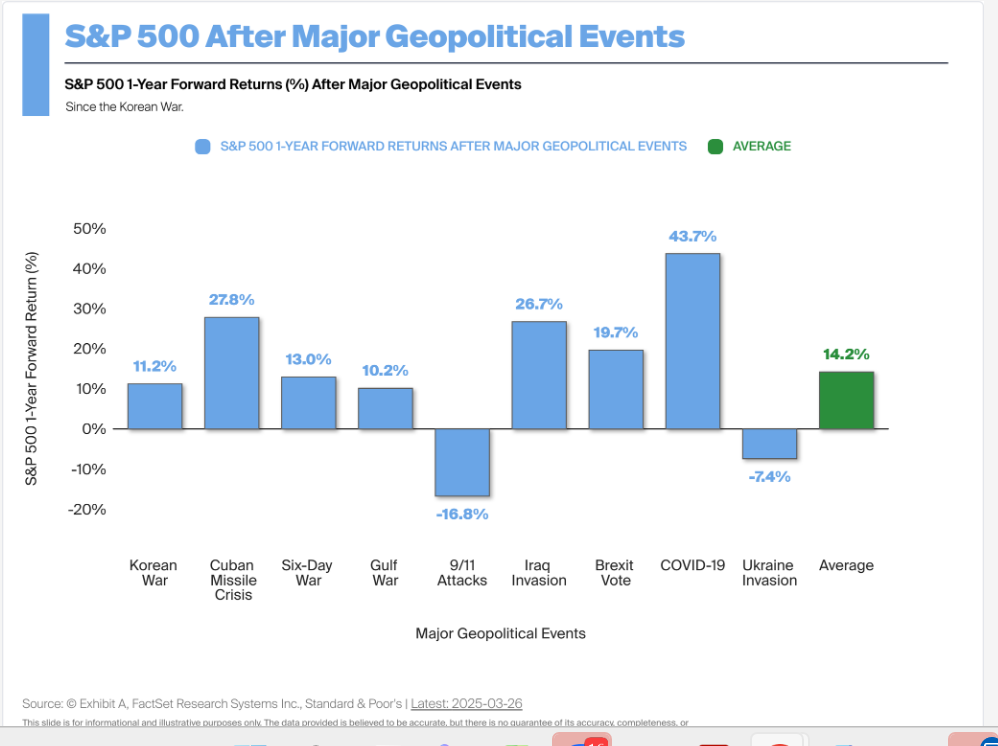
Q1 2026 was dominated by the war in Iran, which started on February 28th when US/Israeli forces bombed Tehran, killing Supreme Leader Ayatollah Ali Khomeini and targeting military infrastructure. Since then, the S&P 500 has taken a roughly 200-point fall (3/20/2026) as a result of rising oil prices and general geopolitical instability across the region and broader globe (NPR, 3/1/2026).
Oil prices shot up roughly $100 after the start of the war, the highest since the start of the Russian war on Ukraine in 2022. On Thursday, 3/19, Israeli forces struck an oil field shared by Qatar and Iran, resulting in counterstrikes that upped the price of oil to $120 a barrel (South China Morning Post, 3/19/2026).
The US has not been in an ongoing, direct military conflict with a nation since August of 2021 when troops were pulled from Afghanistan (Pew Research Center, 8/17/2022). There, geopolitical shocks were short-lived as oil disruptions never came to fruition (Mansfield, 8/27/2026).
With oil a primary concern with the recent war in Iran, the market’s reaction is natural. But this isn’t the first time the US has targeted major oil reserves and received economic sanctions and restrictions in return. Energy as a whole is not a finite resource, and the decisions of one administration may not deter long-term, global market returns.
As mentioned in our trade rationale, we use moments like these to rebalance portfolios. One of our courses of action was increasing weighting on defense stocks and investments, alongside decreasing US and Emerging Market exposure in place of a broadening international exposure to neutral, pulling away from the central players of the Iranian war.
In Asia, Chinese rare earth metals exports rose in Q1, but imports to the US fell (South China Morning Post, 3/26/2026). In Latin America, Venezuela, Iran’s closest ally, could benefit from rising oil prices given their producer capacity (Associated Press, 3/18/2026). Canada also has a large concentration of natural gas and oil reserves that could counteract the supply coming out of the Strait of Hormuz (CBC, 3/11/2026).
Commodities
As Q1 2026 concluded, commodity markets are being driven less by disinflationary trends and more by a sharp rise in geopolitical risk—most notably in the Middle East. This shift has pushed energy prices meaningfully higher, kept precious metals well supported, and introduced renewed volatility across industrial metals and agricultural inputs. At the same time, food commodities remain mixed.
Energy and Oil
Energy has been the clearest pressure point this quarter. Oil prices have moved materially higher, with Brent crude reaching approximately $100.53 per barrel and WTI near $88.78 as of March 25 (EIA Short-Term Energy Outlook, 4/2/2026). Price action has been highly volatile, largely driven by disruption risk around the Strait of Hormuz. Forward expectations reflect this uncertainty: near-term pricing remains elevated, with forecasts suggesting Brent could stay above the mid-$90s before moderating later in 2026. The key takeaway is that geopolitical dynamics—not demand fundamentals—are currently setting the tone for the energy complex.
Precious Metals
Precious metals continue to benefit from heightened geopolitical uncertainty and sustained safe-haven demand. Gold and silver have both experienced significant volatility but remain firmly supported (Reuters, 3/24/2026). Despite recent pullbacks, gold’s strong multi-year rally underscores persistent demand for portfolio hedges in an environment defined by macro and geopolitical instability.
Base and Industrial Metals
Industrial metals have been volatile rather than broadly weak. Copper reached record levels earlier in the quarter and continues to trade near recent highs, even as inventories have increased (Reuters, 2/13/2026). Aluminum has also strengthened, supported in part by supply concerns tied to geopolitical risks. In contrast, battery metals present a more mixed picture—lithium prices, for example, have declined amid softer electric vehicle demand and ongoing uncertainty around global growth (Reuters, 3/3/2026).
Agriculture and Soft Commodities
Agricultural markets remain highly sensitive to weather patterns, freight dynamics, and fertilizer costs. Recent data shows modest increases in global food price indices, with gains in cereals and vegetable oils partially offset by declines in sugar (FAO Food Price Index, 3/4/2026). Cocoa, notably, has retraced sharply from its 2024 peak. At the same time, disruptions tied to geopolitical tensions—particularly those affecting fertilizer supply—introduce a renewed upside risk to food prices, especially in developing markets.
Bottom Line
The defining feature of Q1 2026 is not broad-based commodity inflation, but heightened volatility tied to geopolitical risk.
For markets and policymakers, the shift is clear: geopolitics has re-emerged as a meaningful and unpredictable driver of inflation dynamics.
Government Spending and Deficits
Fiscal Snapshot – Q1 2025
The U.S. fiscal position remains elevated early in 2026. The federal deficit is projected at approximately $1.9 trillion, or about 5.8% of GDP, keeping it near historically high levels. Early fiscal-year data shows the government has already run a deficit of roughly $1.0 trillion in the first five months of FY2026, with spending exceeding $3.1 trillion versus about $2.1 trillion in revenues over that period. Overall federal spending is projected near $7.4 trillion for FY2026, compared to roughly $5.6 trillion in revenues, maintaining a wide structural gap.
Trends & Drivers
Mandatory spending remains the primary driver of fiscal expansion. Programs such as Social Security and Medicare continue to rise with aging demographics, while higher interest rates are pushing net interest costs toward ~$1 trillion annually, making it one of the fastest-growing components of the budget. Early FY2026 data shows revenues rising ~11–12% year-over-year, while spending is increasing more modestly (~2%); however, elevated baseline spending and rising interest costs are limiting the pace of deficit improvement. Policy dynamics remain mixed, with tariff revenues providing some support while tax cuts partially offset these gains, leaving the long-term fiscal trajectory largely unchanged.
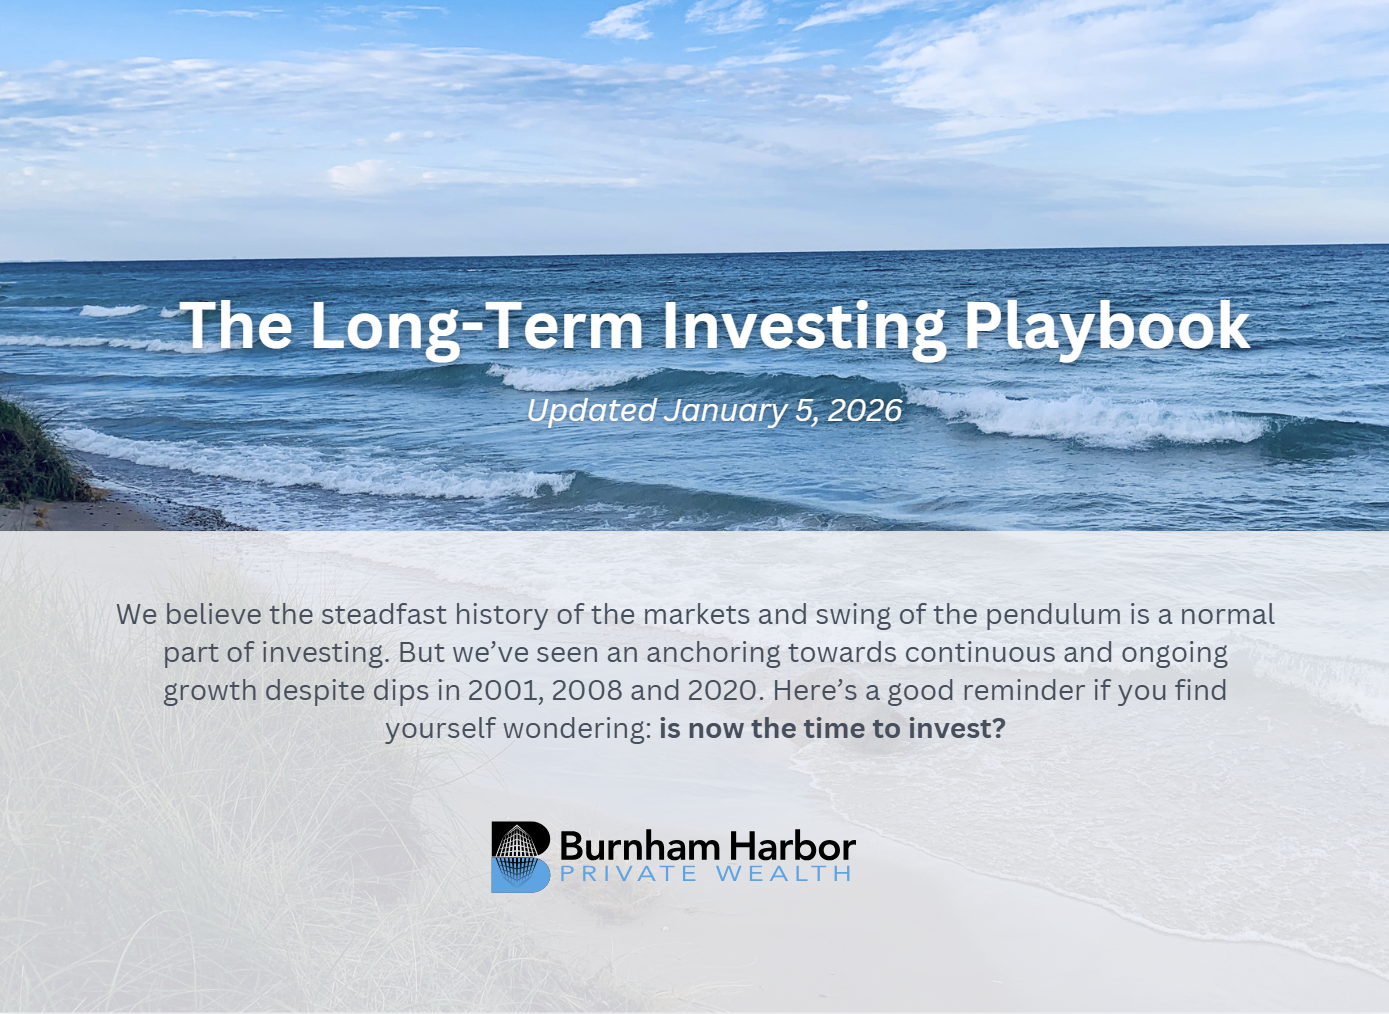
The Long-Term Investing Playbook
As a reminder, most times it is best to ride out the ebbs and flows that the market experiences. Investors who bought on Jan. 1, 2025 and sold during the Liberation Day volatility would’ve experienced a realized loss of <15.09%> versus staying the course until Jan 1, 2026 and being up 17.88%, a 32.97% swing.
What we read/watched/listened to this quarter
Building LLMs for the Physical WorldInterview w/ Sergey Levine
“Sergey argues that solving robotics at full generality is the right path, and that building systems that learn across many robots, environments,
and tasks may be the more scalable approach than building narrow specialists. He discusses how these models can perform new tasks without being trained on them directly, and why everyday human actions remain the hardest problems in the field. He also reflects on how human trust and acceptance may matter as much as technical breakthroughs in determining when robots become part of daily life. ”

James M. Corrigan, CFP®, CPWA®
Managing Partner

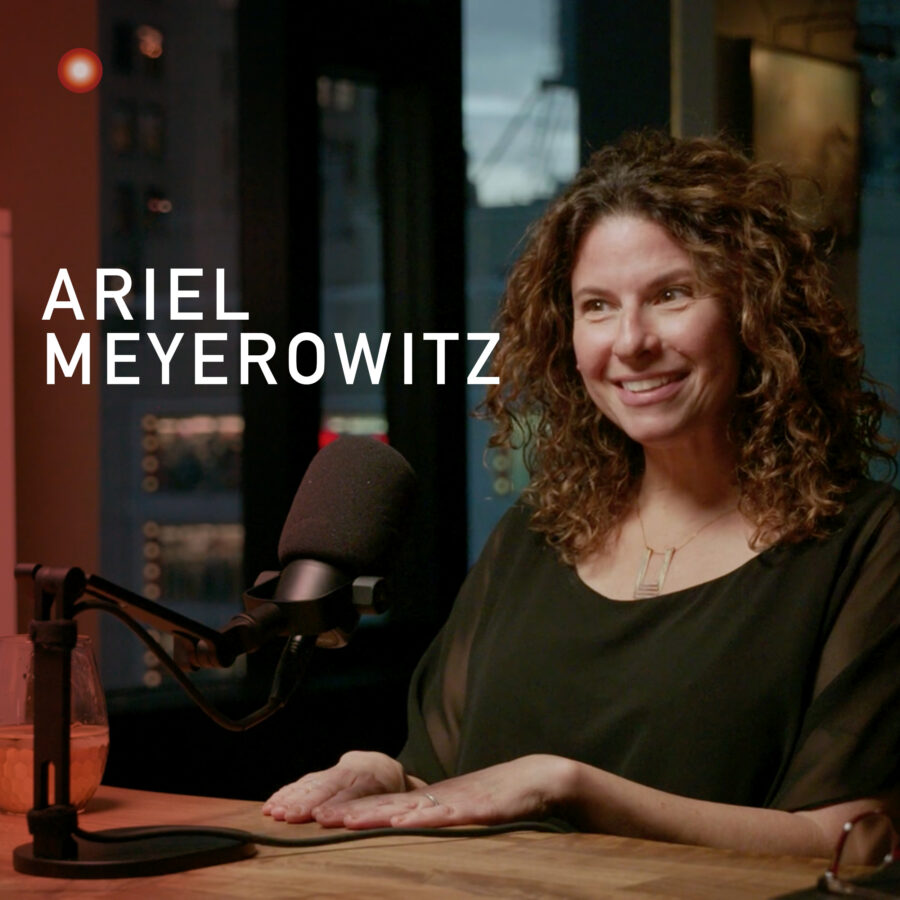
Navigating the Art World with Ariel MeyerowitzInfinite Loops Podcast
“Several recent conversations about private art collections got me thinking more deeply about the topic. This episode felt like a great starting point and I especially appreciated the insights into psychology of collecting.”

Sean M. Jucas, CFP, CPWA, SE-AWMA
Managing Partner
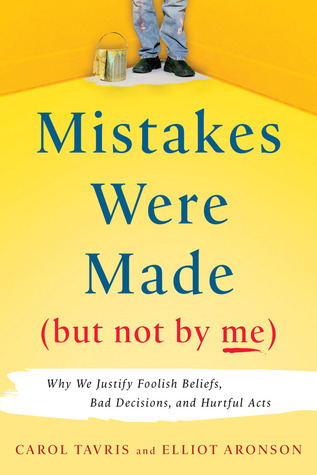
Mistakes Were Made (but Not by me)Why We Justify Foolish Beliefs, Bad Decisions and Hurtful Actsby Carol Tavris and Elliot Aronson.
“The authors explain that cognitive dissonance arises when people are confronted with new evidence that calls into questions their preexisting beliefs. When this happens, unconscious mechanisms enable people to justify and uphold their original positions, despite the evidence to the contrary. The authors discuss that that antidote to cognitive dissonance and self-justification is intellectual humility and systems that catch errors before self-justification kicks in. The concept of cognitive dissonance helps explains why people often engage in activities that have long proven to be futile…like macro forecasting.”

David Holtkamp, CFA, CFP, CPFA
Managing Partner
The Medieval Mind of C.S. Lewisby James M. Baxter
“Explores the “third Lewis”—the lifelong medieval scholar whose deep immersion in the literature, cosmology, and worldview of the Middle Ages profoundly shaped his fiction (especially Narnia), apologetics, and other writings. Baxter shows how the medieval “model” of an ordered, iconic, and sacramental cosmos—harmonious and full of meaning—served as the hidden foundation for Lewis’s imaginative power and critique of the modern world. Concise and insightful, the book argues that Lewis succeeded as a storyteller and thinker precisely because of his devotion to these old books.”

Carla Voss Genelly, CIMA, CPWA, RMA
First Vice President, Wealth Advisor

Hamnet
“Beautiful film but very sad. It had the visuals, the costumes, and acting! I have heard though that the book was even better! That’s my next project!”

Marci Arnheim, CFP
Vice President, Wealth Advisor

The Old Man and The Seaby Ernest Hemingway
“The Old Man and The Sea, by Ernest Hemingway, was a recent read. It follows a Cuban fisherman’s battle with a marlin in the mid 20th century, symbolizing a fight with morality and perceived luck. Looking forward to reading a couple other Ernest Hemingway books during my vacation too!”

Cindy Hehr
Senior Wealth Associate

Second Wind: The Boomer and Gunnar Esiason Story
“This piece follows Boomer Esiason and his son Gunnar Esiason, who was diagnosed with cystic fibrosis at a young age. It highlights Gunnar’s early challenges—before many of today’s treatment advances—as well as the foundation Boomer built to help drive research and progress toward a cure.”

Tracy McBride
Director of Fixed Income and Client Services

The Best Vitality & Health Protocolsby Andrew Huberman ft. Dr. Rhonda Patrick
“This episode features Dr. Rhonda Patrick, PhD, who is focused on translating complex health research into practical guidance. Together Andrew and Dr. Patrick explores evidence-based strategies across exercise, nutrition, supplementation, and lifestyle to support optimal health and reduce disease risk. Dr. Patrick’s work covers topics like effective cardio and resistance training routines, the timing and benefits of intermittent fasting, reducing visceral fat, sourcing omega-3s, and the use of supplements such as creatine and peptide. Overall, she provides a comprehensive framework for building a personalized health plan aligned with individual goals and biology.”

Basel Alwawi
Registered Wealth and Investment Associate

Glaciersby Alexis M. Smith
“A short novel on the art of storytelling through things – in the narrator’s perspective, antique items. Told over the course of one day, Glaciers explores the little moments that make up our lives, from the simple art of dress shopping to the realities of living with war abroad, it sums up the stagnancy of the human experience as time moves on. I felt this was a great Sunday afternoon, winter read!”

Iris Swarthout
Director of Marketing / Registered Client Associate

Burnham’s Blueprint | April 2026
Registered Representatives of Sanctuary Securities Inc. and Investment Advisor Representatives of Sanctuary Advisors, LLC. Securities offered through Sanctuary Securities, Inc., Member FINRA, SIPC. Advisory services offered through Sanctuary Advisors, LLC, an SEC Registered Investment Advisor. Burnham Harbor Private Wealth is a DBA of Sanctuary Securities, Inc. and Sanctuary Advisors, LLC.
No representation is made as to the accuracy or completeness of information contained herein. The information is based upon data available to the public and is not an offer to sell or solicitation of offers to buy any securities mentioned herein. Any forward-looking statements are based on assumptions, may not materialize, and are subject to change without notice. Any investment discussed may not be suitable for all investors. Investors must make their own decisions based on their specific investment objectives and financial circumstances. Investments are subject to risk, including but not limited to market and interest rate fluctuations. Any performance data represents past performance which is no guarantee of future results.